
Horizontal Asymptote: Limit and Function Graph Intersection
Loading the math board and drawing, please wait…
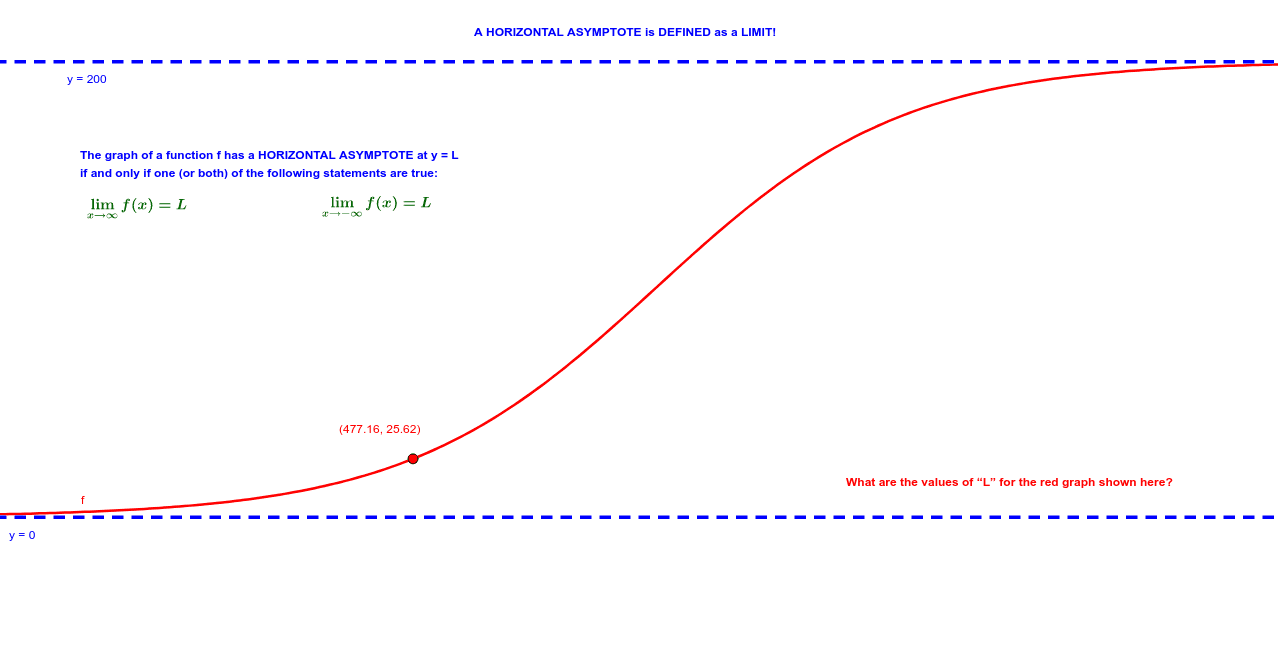
This example demonstrates the concept of a horizontal asymptote through GeoGebra, showing how function graphs approach a horizontal line as input values approach infinity. Key mathematical concepts include limits, function graphs, and asymptotes. Construction involves using objects like Point, f, a, b to build the function and set the asymptote. Suitable for high school students learning calculus fundamentals or university mathematics courses.
GeoGebra Commands & Parameters
Point(f) → A
AI Drawing Prompt Reference
Draw a function graph that approaches a horizontal line above the x-axis, which is the horizontal asymptote of the function. First, draw the function graph, then place a point A on the graph. Define the function f and the horizontal asymptote, and adjust parameters a and b to set the position of the asymptote.
The prompt above was compiled from the original drawing commands and is for reference only.