
Histogram with Frequency Polygon Example
Loading the math board and drawing, please wait…
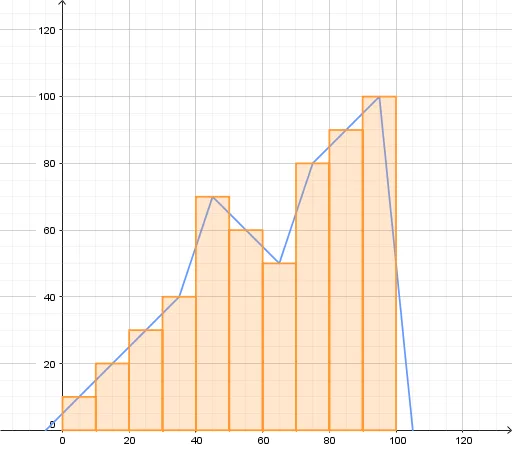
This example demonstrates how to create a histogram and its corresponding frequency polygon for a single data set using GeoGebra. It involves core mathematical concepts such as histograms, frequency polygons, statistical distributions, isosceles triangles, differential calculus, quadrilaterals, cosine, and conic sections. The construction utilizes GeoGebra commands like Histogram and FrequencyPolygon, along with objects like ClassBoundries, ClassHeights, A, and B. It is suitable for high school and above students learning data visualization, statistics, and related geometric properties.
GeoGebra Commands & Parameters
Histogram(ClassBoundries, ClassHeights) → AFrequencyPolygon(ClassBoundries, ClassHeights) → B
AI Drawing Prompt Reference
Draw a histogram and its corresponding frequency polygon using the same dataset. The histogram consists of rectangles with bases at the data interval boundaries and heights representing the frequencies. The frequency polygon is created by connecting the vertices of the histogram, showing the trend of the data distribution. Both graphs share the same data interval boundaries and frequency heights to clearly illustrate their relationship.
The prompt above was compiled from the original drawing commands and is for reference only.