
Histogram (Ungrouped Data) Exercise
Loading the math board and drawing, please wait…
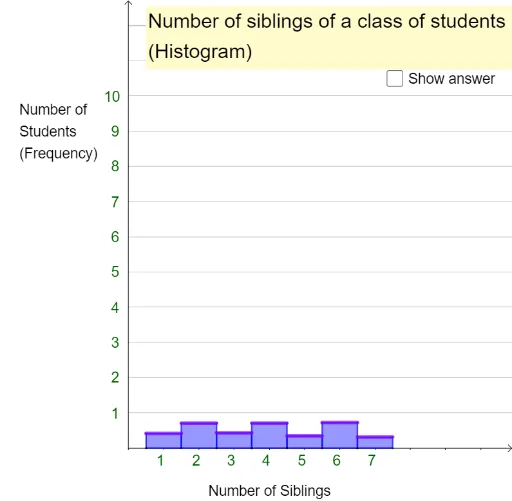
This example demonstrates how students can read data from a frequency table and construct a histogram by dragging the tops of rectangular bars. Key math concepts include frequency distribution, histogram construction, and data visualization. It utilizes GeoGebra commands like Point, Polygon, Segment, Min, Max, and Sequence as per the construction summary. Suitable for middle school and above, focusing on probability & statistics and data analysis basics.
GeoGebra Commands & Parameters
Point(eq_{1}) → A_{1}Point(eq_{2}) → B_{1}Point(eq_{2}) → C_{1}Point(eq_{1}) → D_{1}Polygon(A_{1}, B_{1}, C_{1}, D_{1}) → p_{1}, a_{1}, b_{1}, c_{1}, d_{1}Point(eq_{2}) → A_{2}Point(eq_{3}) → B_{2}Point(eq_{3}) → C_{2}Point(eq_{2}) → D_{2}Polygon(A_{2}, B_{2}, C_{2}, D_{2}) → p_{2}, a_{2}, b_{2}, c_{2}, d_{2}Point(eq_{3}) → A_{3}Point(eq_{4}) → B_{3}Point(eq_{4}) → C_{3}Point(eq_{3}) → D_{3}Polygon(A_{3}, B_{3}, C_{3}, D_{3}) → p_{3}, a_{3}, b_{3}, c_{3}, d_{3}Point(eq_{4}) → A_{4}Point(eq_{5}) → B_{4}Point(eq_{5}) → C_{4}Point(eq_{4}) → D_{4}Polygon(A_{4}, B_{4}, C_{4}, D_{4}) → p_{4}, a_{4}, b_{4}, c_{4}, d_{4}Point(eq_{5}) → A_{5}Point(eq_{6}) → B_{5}Point(eq_{6}) → C_{5}Point(eq_{5}) → D_{5}Polygon(A_{5}, B_{5}, C_{5}, D_{5}) → p_{5}, a_{5}, b_{5}, c_{5}, d_{5}Point(eq_{6}) → A_{6}Point(eq_{7}) → B_{6}Point(eq_{7}) → C_{6}Point(eq_{6}) → D_{6}Polygon(A_{6}, B_{6}, C_{6}, D_{6}) → p_{6}, a_{6}, b_{6}, c_{6}, d_{6}Point(eq_{7}) → A_{7}Point(eq_{8}) → B_{7}Point(eq_{8}) → C_{7}Point(eq_{7}) → D_{7}Polygon(A_{7}, B_{7}, C_{7}, D_{7}) → p_{7}, a_{7}, b_{7}, c_{7}, d_{7}Point(eq_{8}) → A_{8}Point(eq_{9}) → B_{8}Point(eq_{9}) → C_{8}Point(eq_{8}) → D_{8}Polygon(A_{8}, B_{8}, C_{8}, D_{8}) → p_{8}, a_{8}, b_{8}, c_{8}, d_{8}Point(eq_{9}) → A_{9}Point(eq_{10}) → B_{9}Point(eq_{10}) → C_{9}Point(eq_{9}) → D_{9}Polygon(A_{9}, B_{9}, C_{9}, D_{9}) → p_{9}, a_{9}, b_{9}, c_{9}, d_{9}Point(eq_{10}) → A_{10}Point(eq_{11}) → B_{10}Point(eq_{11}) → C_{10}Point(eq_{10}) → D_{10}Polygon(A_{10}, B_{10}, C_{10}, D_{10}) → p_{10}, a_{10}, b_{10}, c_{10}, d_{10}Segment(H_{1}, G_{1}) → h_{1}Segment(H_{2}, G_{2}) → h_{2}Segment(H_{3}, G_{3}) → h_{3}Segment(H_{4}, G_{4}) → h_{4}Segment(H_{5}, G_{5}) → h_{5}Segment(H_{6}, G_{6}) → h_{6}Segment(H_{7}, G_{7}) → h_{7}Segment(H_{8}, G_{8}) → h_{8}Segment(H_{9}, G_{9}) → h_{9}Segment(H_{10}, G_{10}) → h_{10}Min(listxvalues) → minvalueMax(listxvalues) → maxvalueSequence(Text[i, (i - 0.2, -0.5)], i, minvalue, maxvalue) → listxaxislblSequence(Text[j, (-0.5 - floor(lg(j)) / 5, j - 0.15)], j, 1, 10) → listyaxislbl