
Histogram Plotting Template
Loading the math board and drawing, please wait…
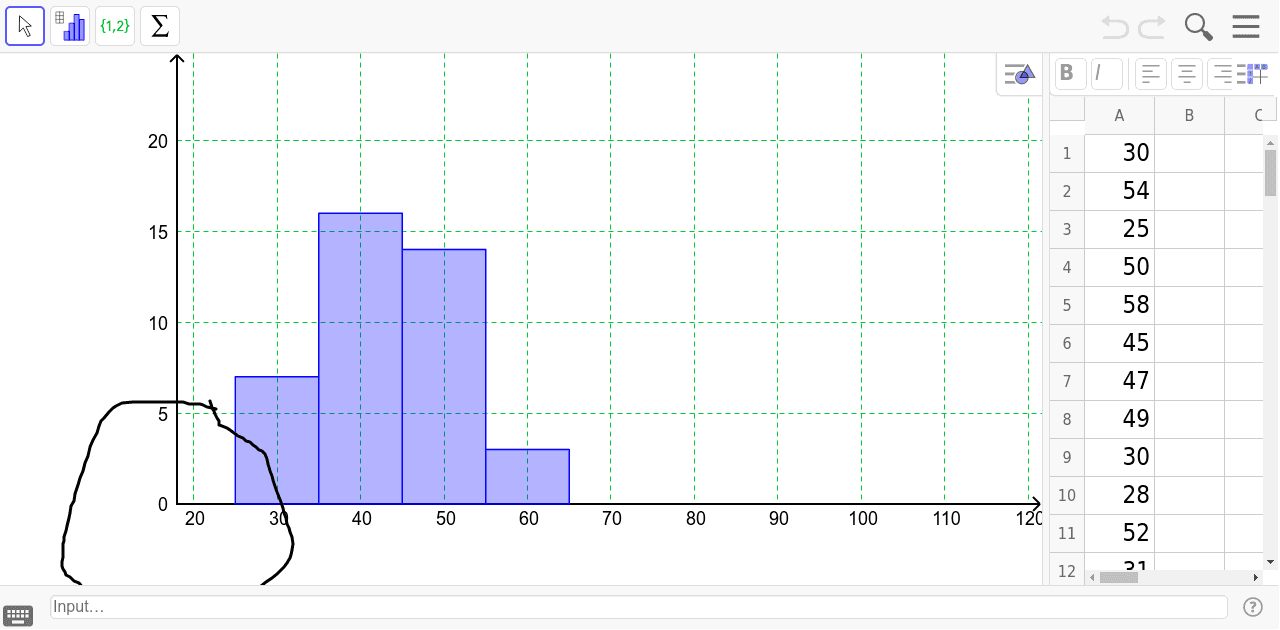
This template is used to generate histograms and observe dynamic changes in histograms as values are altered in the spreadsheet view. It involves core math concepts such as histograms and arithmetic operations. Using GeoGebra commands like Histogram and AttachCopyToView, dynamic histograms can be constructed. Suitable for statistics education or data analysis learning.
GeoGebra Commands & Parameters
Histogram(false, Classes[{A1, A2, A3, A4, A5, A6, A7, A8, A9, A10, A11, A12, A13, A14, A15, A16, A17, A18, A19, A20, A21, A22, A23, A24, A25, A26, A27, A28, A29, A30, A31, A32, A33, A34, A35, A36, A37, A38, A39, A40}, 25, 10], {A1, A2, A3, A4, A5, A6, A7, A8, A9, A10, A11, A12, A13, A14, A15, A16, A17, A18, A19, A20, A21, A22, A23, A24, A25, A26, A27, A28, A29, A30, A31, A32, A33, A34, A35, A36, A37, A38, A39, A40}, true, -1) → bAttachCopyToView(PolyLine[(26.23400522193208, 3.705410239085369), (25.844783289817197, 3.7501203729433144), (25.358255874673596, 3.7948305068012598), (24.969033942558713, 3.8842507745171506), (24.677117493472554, 3.928960908375096), (24.09328459530023, 3.928960908375096), (23.606757180156627, 3.928960908375096), (23.314840731070465, 3.973671042233041), (23.022924281984306, 4.018381176090987), (22.34178590078326, 4.018381176090987), (21.660647519582216, 4.018381176090987), (21.271425587467334, 4.018381176090987), (20.590287206266293, 4.018381176090987), (20.006454308093968, 4.018381176090987), (19.325315926892927, 4.018381176090987), (18.936093994778044, 4.018381176090987), (18.15765013054828, 4.018381176090987), (17.087289817232353, 3.973671042233041), (16.50345691906003, 3.839540640659205), (16.21154046997387, 3.7501203729433144), (15.822318537858989, 3.571279837511533), (15.335791122715385, 3.3030190343638606), (15.043874673629224, 3.1688886327900248), (14.849263707571783, 2.9453379635002976), (14.654652741514342, 2.63236702649468), (14.26543080939946, 2.3193960894890626), (13.973514360313299, 2.006425152483445), (13.778903394255858, 1.6040339477619368), (13.486986945169695, 1.2910630107563192), (13.292375979112254, 0.9333819398927563), (13.000459530026093, 0.6204110028871387), (12.805848563968652, 0.3074400658815211), (12.513932114882492, -0.09495113883998715), (12.41662663185377, -0.40792207584560475), (12.12471018276761, -0.6314727451353316), (12.027404699738888, -0.9444436821409491), (11.930099216710168, -1.1679943514306759), (11.832793733681447, -1.3468348868624573), (11.735488250652727, -1.5256754222942388), (11.638182767624006, -1.7492260915839657), (11.540877284595286, -1.8833564931578017), (11.443571801566565, -2.017486894731638), (11.443571801566565, -2.1963274301634192), (11.346266318537845, -2.3304578317372555), (11.346266318537845, -2.554008501026982), (11.346266318537845, -2.732849036458764), (11.346266318537845, -2.911689571890545), (11.248960835509125, -3.1352402411802722), (11.248960835509125, -3.3140807766120535), (11.346266318537845, -3.4482111781858897), (11.540877284595286, -3.5823415797597256), (11.638182767624006, -3.716471981333562), (12.027404699738888, -3.8058922490494527), (12.41662663185377, -3.984732784481234), (12.903154046997372, -4.074153052197125), (13.389681462140976, -4.342413855344797), (13.973514360313299, -4.5659645246345235), (14.55734725848562, -4.70009492620836), (15.043874673629224, -4.8789354616401415), (15.530402088772826, -4.968355729356032), (16.11423498694515, -5.147196264787814), (16.406151436031312, -5.281326666361649), (16.892678851174914, -5.37074693407754), (17.281900783289796, -5.415457067935486), (17.573817232375955, -5.5048773356513765), (18.06034464751956, -5.5048773356513765), (18.546872062663162, -5.415457067935486), (19.033399477806764, -5.326036800219595), (19.617232375979086, -5.281326666361649), (20.29837075718013, -5.1919063986457585), (20.882203655352452, -5.147196264787814), (21.75795300261094, -5.102486130929869), (22.43909138381198, -5.013065863213978), (23.022924281984306, -5.013065863213978), (23.704062663185347, -4.968355729356032), (24.287895561357672, -4.923645595498087), (24.871728459529994, -4.923645595498087), (25.455561357702315, -4.923645595498087), (25.844783289817197, -4.8789354616401415), (26.23400522193208, -4.8789354616401415), (26.915143603133124, -4.834225327782196), (27.304365535248007, -4.834225327782196), (27.79089295039161, -4.789515193924251), (28.08280939947777, -4.744805060066305), (28.472031331592653, -4.655384792350414), (28.861253263707535, -4.610674658492469), (29.250475195822418, -4.521254390776578), (29.542391644908577, -4.431834123060688), (30.02891906005218, -4.342413855344797), (30.612751958224504, -4.208283453770961), (31.099279373368105, -4.029442918339179), (31.683112271540427, -3.850602382907398), (32.16963968668403, -3.6717618474756164), (32.558861618798915, -3.492921312043835), (32.850778067885074, -3.358790910469999), (33.14269451697123, -3.1799503750382176), (33.4346109660574, -2.9563997057484905), (33.53191644908612, -2.8222693041746547), (33.62922193211484, -2.5987186348849276), (33.72652741514356, -2.3304578317372555), (33.62922193211484, -2.017486894731638), (33.4346109660574, -1.7939362254419111), (33.33730548302868, -1.6150956900101296), (33.14269451697123, -1.4362551545783482), (33.04538903394251, -1.1679943514306759), (32.850778067885074, -0.9444436821409491), (32.753472584856354, -0.7208930128512223), (32.558861618798915, -0.4526322097035501), (32.364250652741475, -0.22908154041382325), (32.16963968668403, -0.005530871124096424), (31.97502872062659, 0.26272993202357575), (31.78041775456915, 0.530990735171248), (31.683112271540427, 0.7098312706030294), (31.488501305482988, 0.9333819398927563), (31.391195822454268, 1.1122224753245378), (31.29389033942555, 1.2463528768983738), (31.196584856396825, 1.4699035461881007), (31.001973890339386, 1.6934542154778276), (30.710057441253223, 1.8275846170516636), (30.41814099216706, 1.872294750909609), (30.1262245430809, 2.006425152483445), (29.83430809399474, 2.095845420199336), (29.542391644908577, 2.2299758217731718), (29.153169712793694, 2.274685955631117), (28.861253263707535, 2.4088163572049535), (28.374725848563934, 2.4982366249208443), (27.98550391644905, 2.63236702649468), (27.59628198433417, 2.7664974280685164), (27.304365535248007, 2.8559176957844072), (26.817838120104405, 2.9453379635002976), (26.525921671018242, 2.990048097358243), (26.525921671018242, 3.1688886327900248), (26.331310704960803, 3.3030190343638606), (26.13669973890336, 3.4818595697956423), (26.03939425587464, 3.615989971369478), (25.844783289817197, 3.7501203729433144), (25.747477806788478, 3.928960908375096), (25.650172323759758, 4.063091309948932), true], 1, (5.216020887728453, -7.248572556111246), (76.93016187989545, 19.62221789251392), (0, 601), (737, 0)) → stroke1
AI Drawing Prompt Reference
Create a histogram with 39 intervals on the x-axis and frequency on the y-axis. Use the given 39 interval boundaries to generate the histogram. Then, draw a polyline connecting the peaks of the histogram, starting from the highest point and extending downwards to the bottom boundary of the histogram.
The prompt above was compiled from the original drawing commands and is for reference only.