
Histogram: Equal Widths by Tom Carpenter
Loading the math board and drawing, please wait…
In collections
Concrete-Pictorial-Abstract and the Teaching for Mastery
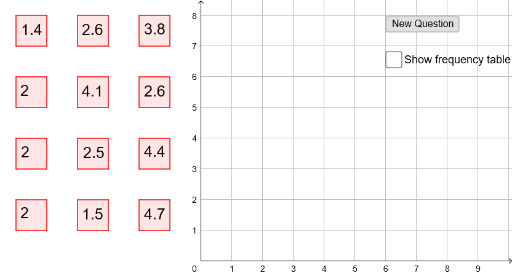
① This example demonstrates how to construct an equal-width histogram in GeoGebra, visualizing the frequency distribution of data across intervals of equal size. ② Core mathematical concepts include frequency counting, interval binning, data grouping, and the geometric representation of histograms, rooted in probability and statistics. ③ Construction highlights: from the summary, commands such as Polygon (to draw bars), CountIf (to count data points per interval), TableText (to generate a data table), and Histogram (to directly create the histogram) are used; objects include multiple points, polygons, and variables, with repeated structures (e.g., A1 to A12) to define equal-width bins. ④ Suitable for middle school or introductory statistics courses, helping students grasp distribution shapes, frequency density, and the impact of bin width, and enabling comparison with equal-frequency histograms.
GeoGebra Commands & Parameters
Polygon(A, B, C, D) → poly1, a, b, c, dPolygon(A_1, B_1, C_1, D_1) → poly1_1, a_1, b_1, c_1, d_1Polygon(A_2, B_2, C_2, D_2) → poly1_2, a_2, b_2, c_2, d_2Polygon(A_3, B_3, C_3, D_3) → poly1_3, a_3, b_3, c_3, d_3Polygon(A_4, B_4, C_4, D_4) → poly1_4, a_4, b_4, c_4, d_4Polygon(A_5, B_5, C_5, D_5) → poly1_5, a_5, b_5, c_5, d_5Polygon(A_6, B_6, C_6, D_6) → poly1_6, a_6, b_6, c_6, d_6Polygon(A_7, B_7, C_7, D_7) → poly1_7, a_7, b_7, c_7, d_7Polygon(A_8, B_8, C_8, D_8) → poly1_8, a_8, b_8, c_8, d_8Polygon(A_9, B_9, C_9, D_9) → poly1_9, a_9, b_9, c_9, d_9Polygon(A_{10}, B_{10}, C_{10}, D_{10}) → poly1_{10}, a_{10}, b_{10}, c_{10}, d_{10}Polygon(A_{11}, B_{11}, C_{11}, D_{11}) → poly1_{11}, a_{11}, b_{11}, c_{11}, d_{11}CountIf(B5, list1) → C5CountIf(B6, list1) → C6CountIf(B7, list1) → C7CountIf(B8, list1) → C8CountIf(B9, list1) → C9TableText({{B4, C4}, {B5, C5}, {B6, C6}, {B7, C7}, {B8, C8}, {B9, C9}}, "|_") → text13Histogram({0, 1, 2, 3, 4, 5}, list1) → f
AI Drawing Prompt Reference
Create an equal-width histogram to visualize the frequency distribution of data across intervals of equal size. Use multiple polygons to draw the bars of the histogram, with each polygon representing an interval. Determine the height of each bar by counting the number of data points within its corresponding interval. First, generate a data table showing the boundaries of each interval and their respective frequency counts. Finally, directly create a histogram to visualize the overall frequency distribution, ensuring all bars have equal width for a clear representation of the data's distribution.
The prompt above was compiled from the original drawing commands and is for reference only.