
Histogram and Stats from Data
Loading the math board and drawing, please wait…
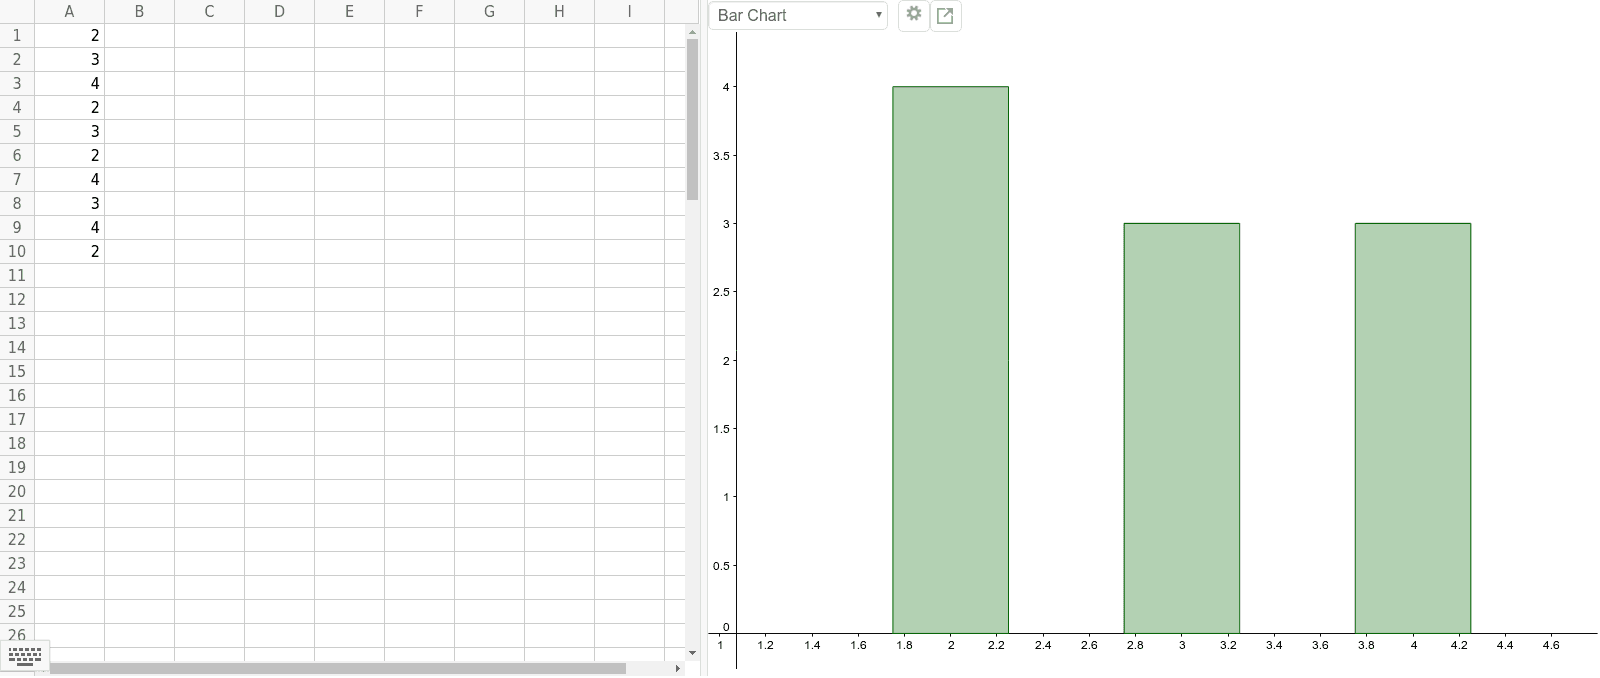
This example demonstrates how to create a histogram from data and calculate statistics, involving core concepts like histograms, percentages, linear programming/optimization, integers, translation, and sine functions. It uses GeoGebra objects A1 to A10 for data input and visualization, suitable for high school mathematics teaching in probability statistics and optimization algorithms.
GeoGebra Commands & Parameters
2342324342