
Histogram and Statistics Demonstration
Loading the math board and drawing, please wait…
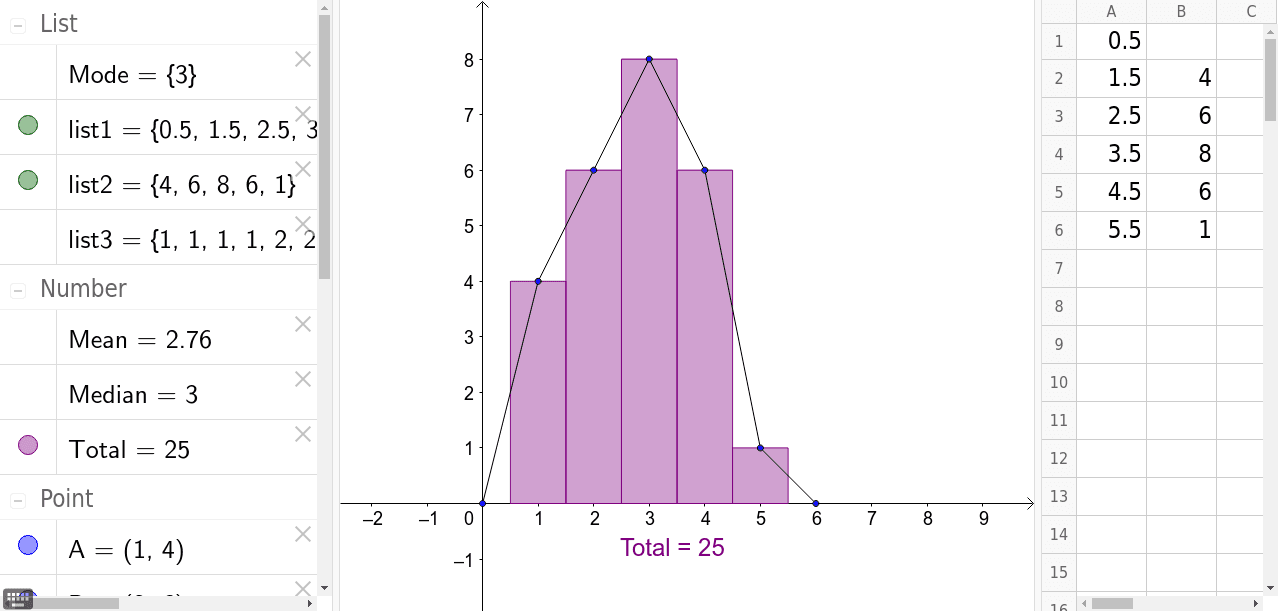
This example demonstrates how to use GeoGebra to create a histogram and calculate statistics like mean, median, mode, etc. Core math concepts include histogram, coordinates, statistics calculation, linear programming, similarity transformation. Construction highlights involve commands/objects like Histogram, Mean, Median, Mode, Segment. Suitable for high school mathematics teaching or introductory statistics learning.
GeoGebra Commands & Parameters
Histogram(list1, list2) → TotalMean(list3) → MeanMedian(list3) → MedianMode(list3) → ModeSegment(A, B) → aSegment(B, C) → bSegment(C, D) → cSegment(D, E) → dSegment(F, A) → eSegment(E, G) → f
AI Drawing Prompt Reference
Draw a histogram to show the distribution of a set of data. Calculate and mark the mean, median, and mode of this data set. Use points A, B, C, D, E, F, and G as vertices of a coordinate system and connect them to form a closed polygon.
The prompt above was compiled from the original drawing commands and is for reference only.