
Histogram and Frequency Distribution of Random Data
Loading the math board and drawing, please wait…
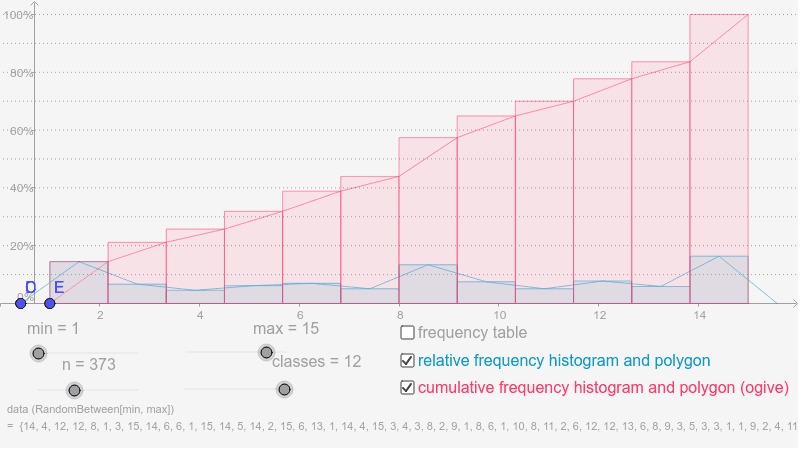
This example demonstrates the process of transforming a set of randomly generated numerical data into a histogram and a frequency polygon to analyze data distribution patterns. The core mathematical concepts involve statistical grouping, frequency calculation, and distribution analysis. The construction utilizes the 'Sequence' command for data generation, 'Classes' and 'Frequency' for binning and counting, and 'Histogram' and 'FrequencyPolygon' for visualization, supplemented by 'TableText' for tabular data representation. It is ideal for high school or introductory college statistics courses to teach data dispersion and the creation of statistical charts.
GeoGebra Commands & Parameters
Sequence(Random[min, max], i, 1, n) → list1Classes(list1, classes) → list2Frequency(list2, list1) → list5Histogram(list2, list1, true, 100 * (max - min) / (n * classes)) → aFrequencyPolygon(list2, list1, true, 100 * (max - min) / (n * classes)) → bHistogram(true, list2, list1, true, 100 * (max - min) / (n * classes)) → eFrequencyPolygon(true, list2, list1, true, 100 * (max - min) / (n * classes)) → fSequence("[" * Element[list2, i] * " - " * Element[list2, i + 1] * ")", i, 1, classes - 1) → list3Append(list3, "[" * Element[list2, classes] * " - " * Element[list2, classes + 1] * "]") → list4Sequence(Sum[list6, i], i, 1, classes) → list7Append("classes", list4) → list8Append("f%", list6) → list9Append("F%", list7) → list10Sequence(Segment[(min - 2, i), (max + 2, i)], i, 10, 100, 10) → list11TableText({list8, list9, list10}, "vl") → text1
AI Drawing Prompt Reference
Please draw a histogram and frequency polygon from randomly generated numerical data to analyze data distribution patterns. First, generate a set of random data, then divide it into intervals and calculate the frequency of each interval. Next, draw the histogram and frequency polygon, and add labeled versions. Also, generate interval lists, calculate frequency percentages and cumulative frequency percentages, and draw vertical line segments. Finally, present the data in a table format. This process aims to demonstrate data dispersion and the creation of statistical charts.
The prompt above was compiled from the original drawing commands and is for reference only.