
Histogram and Box Plot Analysis of Heights from Large Data Set
Loading the math board and drawing, please wait…
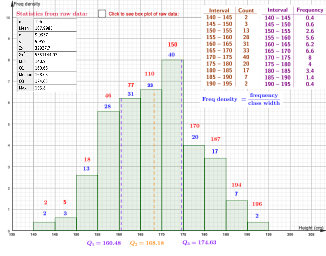
This GeoGebra example demonstrates statistical visualization of a large dataset containing 40 height data points. The core mathematical concepts include histogram construction principles, box plot components (minimum, quartiles, median, maximum), and frequency table generation. Construction highlights: using the Histogram command to display data distribution, BoxPlot command to show central tendency and dispersion, FrequencyTable command to generate grouped frequency data, and Segment command for auxiliary lines. This example is suitable for high school mathematics statistics and probability units, as well as introductory college statistics courses, helping students understand graphical representations of descriptive statistics.
GeoGebra Commands & Parameters
Histogram(false, Classes[{A1, A2, A3, A4, A5, A6, A7, A8, A9, A10, A11, A12, A13, A14, A15, A16, A17, A18, A19, A20, A21, A22, A23, A24, A25, A26, A27, A28, A29, A30, A31, A32, A33, A34, A35, A36, A37, A38, A39, A40, A41, A42, A43, A44, A45, A46, A47, A48, A49, A50, A51, A52, A53, A54, A55, A56, A57, A58, A59, A60, A61, A62, A63, A64, A65, A66, A67, A68, A69, A70, A71, A72, A73, A74, A75, A76, A77, A78, A79, A80, A81, A82, A83, A84, A85, A86, A87, A88, A89, A90, A91, A92, A93, A94, A95, A96, A97, A98, A99, A100, A101, A102, A103, A104, A105, A106, A107, A108, A109, A110, A111, A112, A113, A114, A115, A116, A117, A118, A119, A120, A121, A122, A123, A124, A125, A126, A127, A128, A129, A130, A131, A132, A133, A134, A135, A136, A137, A138, A139, A140, A141, A142, A143, A144, A145, A146, A147, A148, A149, A150, A151, A152, A153, A154, A155, A156, A157, A158, A159, A160, A161, A162, A163, A164, A165, A166, A167, A168, A169, A170, A171, A172, A173, A174, A175, A176, A177, A178, A179, A180, A181, A182, A183, A184, A185, A186, A187, A188, A189, A190, A191, A192, A193, A194, A195, A196}, 140, 5], {A1, A2, A3, A4, A5, A6, A7, A8, A9, A10, A11, A12, A13, A14, A15, A16, A17, A18, A19, A20, A21, A22, A23, A24, A25, A26, A27, A28, A29, A30, A31, A32, A33, A34, A35, A36, A37, A38, A39, A40, A41, A42, A43, A44, A45, A46, A47, A48, A49, A50, A51, A52, A53, A54, A55, A56, A57, A58, A59, A60, A61, A62, A63, A64, A65, A66, A67, A68, A69, A70, A71, A72, A73, A74, A75, A76, A77, A78, A79, A80, A81, A82, A83, A84, A85, A86, A87, A88, A89, A90, A91, A92, A93, A94, A95, A96, A97, A98, A99, A100, A101, A102, A103, A104, A105, A106, A107, A108, A109, A110, A111, A112, A113, A114, A115, A116, A117, A118, A119, A120, A121, A122, A123, A124, A125, A126, A127, A128, A129, A130, A131, A132, A133, A134, A135, A136, A137, A138, A139, A140, A141, A142, A143, A144, A145, A146, A147, A148, A149, A150, A151, A152, A153, A154, A155, A156, A157, A158, A159, A160, A161, A162, A163, A164, A165, A166, A167, A168, A169, A170, A171, A172, A173, A174, A175, A176, A177, A178, A179, A180, A181, A182, A183, A184, A185, A186, A187, A188, A189, A190, A191, A192, A193, A194, A195, A196}, true, -1) → bBoxPlot(1, 0.5, {A1, A2, A3, A4, A5, A6, A7, A8, A9, A10, A11, A12, A13, A14, A15, A16, A17, A18, A19, A20, A21, A22, A23, A24, A25, A26, A27, A28, A29, A30, A31, A32, A33, A34, A35, A36, A37, A38, A39, A40, A41, A42, A43, A44, A45, A46, A47, A48, A49, A50, A51, A52, A53, A54, A55, A56, A57, A58, A59, A60, A61, A62, A63, A64, A65, A66, A67, A68, A69, A70, A71, A72, A73, A74, A75, A76, A77, A78, A79, A80, A81, A82, A83, A84, A85, A86, A87, A88, A89, A90, A91, A92, A93, A94, A95, A96, A97, A98, A99, A100, A101, A102, A103, A104, A105, A106, A107, A108, A109, A110, A111, A112, A113, A114, A115, A116, A117, A118, A119, A120, A121, A122, A123, A124, A125, A126, A127, A128, A129, A130, A131, A132, A133, A134, A135, A136, A137, A138, A139, A140, A141, A142, A143, A144, A145, A146, A147, A148, A149, A150, A151, A152, A153, A154, A155, A156, A157, A158, A159, A160, A161, A162, A163, A164, A165, A166, A167, A168, A169, A170, A171, A172, A173, A174, A175, A176, A177, A178, A179, A180, A181, A182, A183, A184, A185, A186, A187, A188, A189, A190, A191, A192, A193, A194, A195, A196}, true) → aHistogram(l1, l3, true) → cSegment(A, B) → gFrequencyTable(l1, l3) → text23Segment(C, D) → hSegment(E, F) → lFrequencyTable(l1, l3, true) → text37
AI Drawing Prompt Reference
Create a statistical visualization with a histogram, box plot, and frequency table to show the distribution of heights from a dataset of 40 data points. The histogram uses 10 classes, and the box plot displays the minimum, quartiles, median, and maximum values. A frequency table presents grouped data. Include auxiliary line segments to mark and connect key data points, illustrating the central tendency and dispersion in the dataset.
The prompt above was compiled from the original drawing commands and is for reference only.