
Histogram 3
Loading the math board and drawing, please wait…
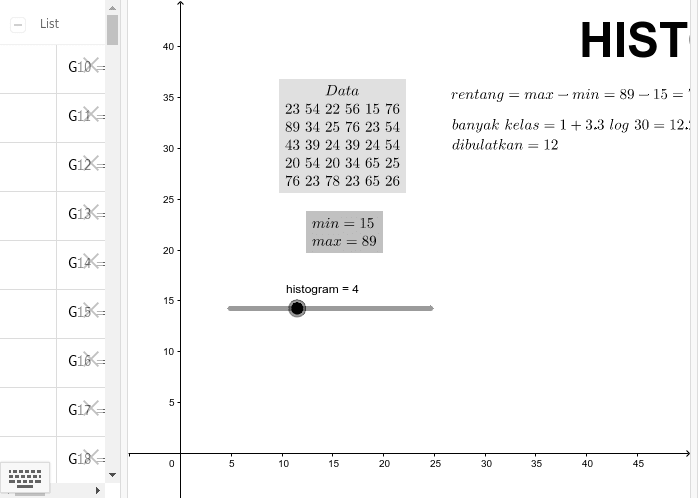
This example demonstrates the construction of a histogram. It involves the concept of frequency distribution in statistics. Using GeoGebra commands such as Frequency, Histogram, and Segment, a clear histogram can be created. Suitable for middle school students learning probability and statistics.
GeoGebra Commands & Parameters
Frequency(list2, list1) → G10Frequency(list3, list1) → G11Frequency(list4, list1) → G12Frequency(list5, list1) → G13Frequency(list6, list1) → G14Frequency(list7, list1) → G15Frequency(list8, list1) → G16Frequency(list9, list1) → G17Frequency(list10, list1) → G18Frequency(list11, list1) → G19Frequency(list12, list1) → G20Frequency(list13, list1) → G21Frequency(list14, list1) → G22Histogram(list15, list16) → aSegment(A, B) → fSegment(B, C) → gSegment(C, D) → hSegment(D, E) → iSegment(E, F) → jSegment(F, G) → kSegment(G, H) → l
AI Drawing Prompt Reference
Create a histogram to show the frequency distribution of a set of data. First, calculate the frequency of data in each interval to get G10 to G22. Then, use segments A to H to draw the histogram.
The prompt above was compiled from the original drawing commands and is for reference only.