
Histogram and Integral Calculus
Loading the math board and drawing, please wait…
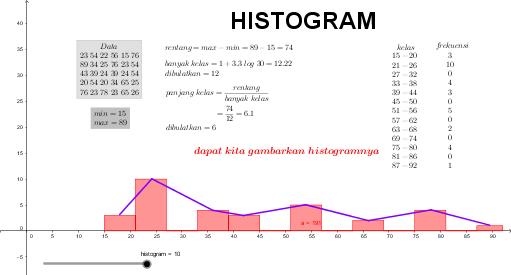
This example demonstrates how to create a histogram using GeoGebra and illustrates the basic principles of integral calculus. Key math concepts include histogram, integral, upper and lower sums or Riemann sums, and geometric transformations. The construction involves commands like Frequency, Histogram, and Segment. Suitable for high school mathematics, it combines probability and statistics with calculus concepts.
GeoGebra Commands & Parameters
Frequency(list2, list1) → G10Frequency(list3, list1) → G11Frequency(list4, list1) → G12Frequency(list5, list1) → G13Frequency(list6, list1) → G14Frequency(list7, list1) → G15Frequency(list8, list1) → G16Frequency(list9, list1) → G17Frequency(list10, list1) → G18Frequency(list11, list1) → G19Frequency(list12, list1) → G20Frequency(list13, list1) → G21Frequency(list14, list1) → G22Histogram(list15, list16) → aSegment(A, B) → fSegment(B, C) → gSegment(C, D) → hSegment(D, E) → iSegment(E, F) → jSegment(F, G) → kSegment(G, H) → l
AI Drawing Prompt Reference
Create a histogram showing frequency distributions across different intervals, and connect the vertices of these intervals with line segments to form a closed polygon, demonstrating the basics of integral calculus and geometric transformations, where the histogram is generated from multiple data lists and the segments connect the vertices sequentially to create a geometric shape.
The prompt above was compiled from the original drawing commands and is for reference only.