
Hispanic Voters Simulation (1-prop z)
Loading the math board and drawing, please wait…
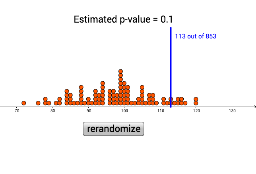
This example demonstrates a Hispanic voters simulation (1-prop z test), involving core concepts in probability and statistics. Using GeoGebra commands such as Sequence, DotPlot, CountIf, and Segment, an intuitive probability distribution graph is constructed. Suitable for high school and above students or teachers to understand the process and application of the 1-prop z test.
GeoGebra Commands & Parameters
Sequence(RandomBinomial[853, 0.117], n, 1, 100) → list1DotPlot(list1, false, 0.2) → list2CountIf(x > 0, list1) → aSegment((113, 0), (113, 4)) → f
AI Drawing Prompt Reference
Create a dot plot showing the results of 100 trials of a binomial distribution with 853 trials and a success rate of approximately 11.7%. Mark the point on the x-axis where the number of successes is 113 and draw a vertical line to indicate this point.
The prompt above was compiled from the original drawing commands and is for reference only.