
H - Derivatives: Tangent, Slope, and Histogram Visualization
Loading the math board and drawing, please wait…
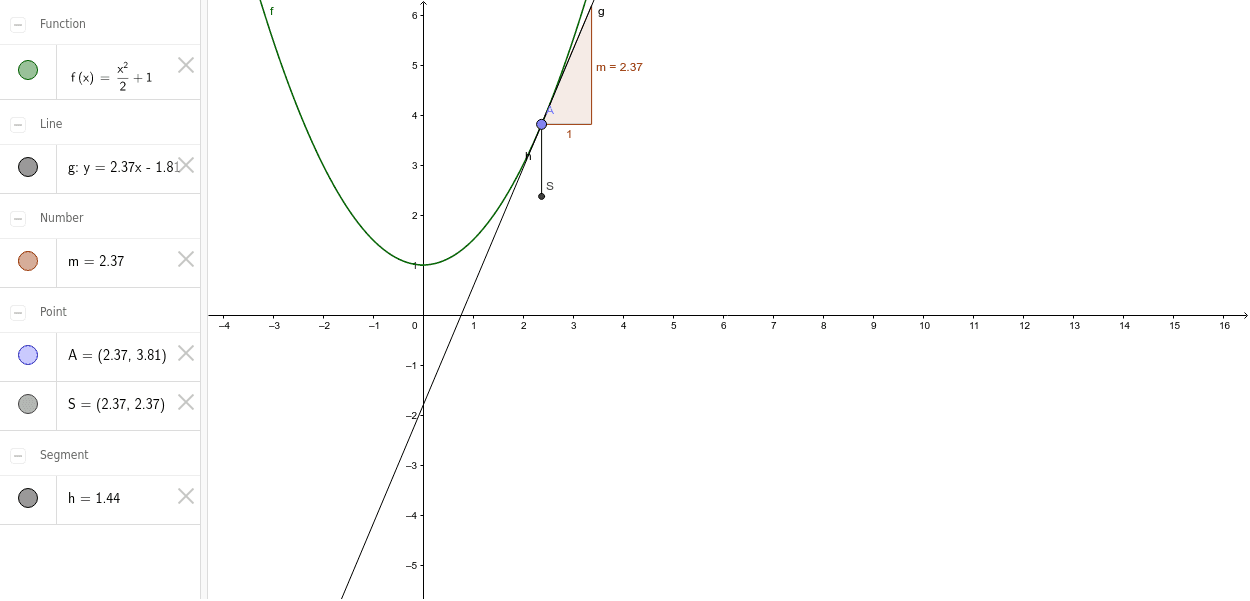
① This example demonstrates the geometric meaning of derivatives by showing the tangent line and its slope at a moving point on a function graph, alongside a histogram for data distribution. ② Core mathematical concepts include the derivative as the instantaneous rate of change, the slope of the tangent line, and connections to linear programming/optimization and real numbers. ③ Construction uses GeoGebra commands: Point, Tangent, Slope, and Segment, with objects f (function), A (point), g (tangent), m (slope), S and h (segments), allowing dynamic exploration as point A moves along the curve. ④ Suitable for high school to early college calculus courses, ideal for teachers demonstrating derivative concepts and local linear approximation, or for students to investigate relationships between derivatives, monotonicity, and extrema.
GeoGebra Commands & Parameters
Point(f) → ATangent(A, f) → gSlope(g) → mSegment(A, S) → h
AI Drawing Prompt Reference
Draw a function curve with a movable point on it. At this point, construct a tangent line to the curve and display its slope value. From the point, drop a vertical segment to a horizontal reference line, showing the distance between them. The graph should emphasize how the tangent line and its slope change as the point moves along the curve, and include a histogram to illustrate the connection between derivatives and data distribution.
The prompt above was compiled from the original drawing commands and is for reference only.