
H-Derivatives: Dynamic Tangent Slope Demonstration
Loading the math board and drawing, please wait…
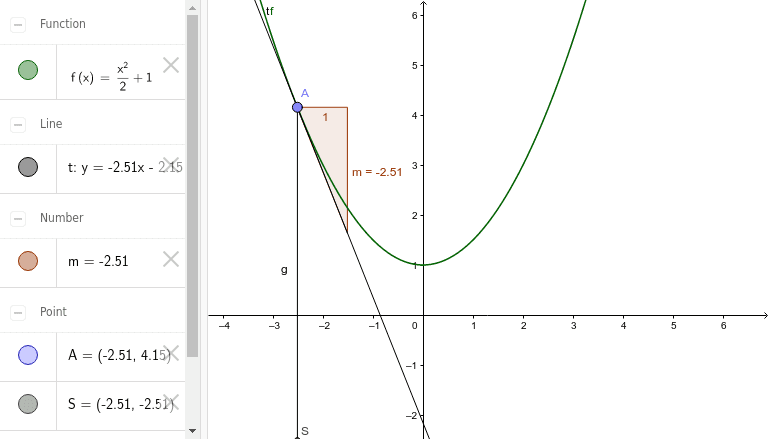
This GeoGebra example dynamically illustrates the geometric meaning of derivatives by showing the tangent line and its slope at a movable point A on a function f. The core mathematical concept is the derivative, representing the instantaneous rate of change, visualized as the slope of the tangent. Construction steps involve using the Point command to create a dynamic point A on the function, Tangent to generate the tangent line t, Slope to compute and display the slope value m, and Segment to construct auxiliary segment S, with objects f and g possibly involved. Suitable for high school or introductory college calculus students to grasp the relationship between derivatives and tangent slopes, and useful for classroom demonstrations.
GeoGebra Commands & Parameters
Point(f) → ATangent(A, f) → tSlope(t) → mSegment(A, S) → g