
Geogebra Interactive Geometry & Functions Example
Loading the math board and drawing, please wait…
In collections
Project 2Modeling Parabolas using GeoGebraUs
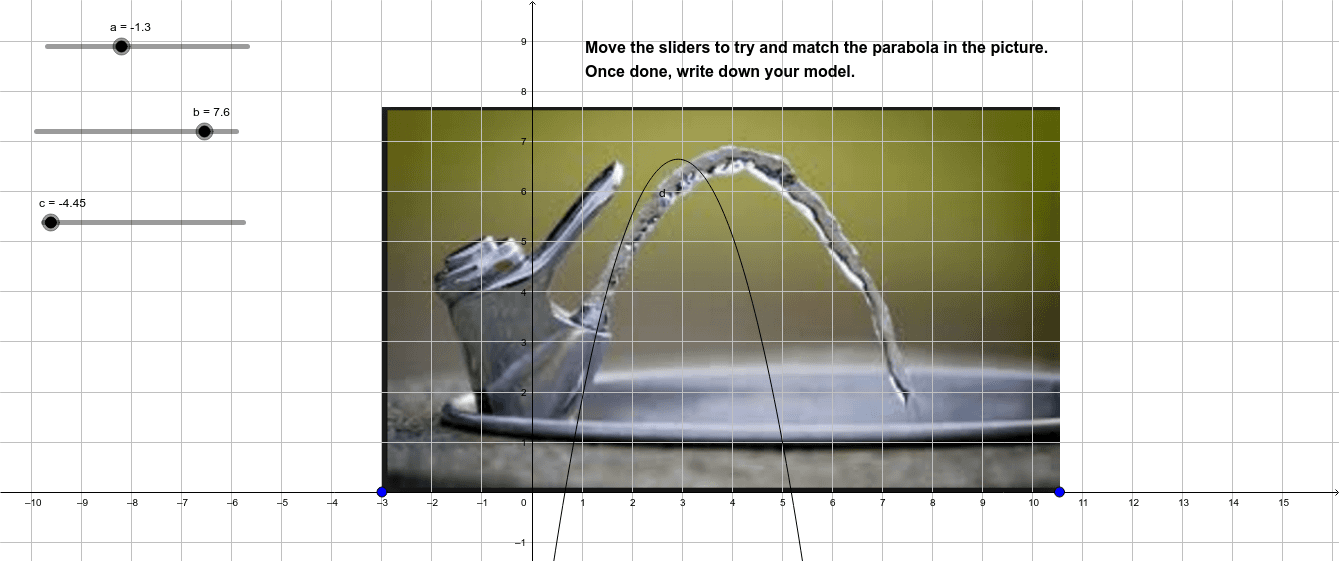
This example demonstrates geometric and functional interactions involving subtraction, logarithmic functions, circles, reflections, and power functions using GeoGebra software. Key math concepts include the properties of logarithmic functions, geometric characteristics of circles, reflection transformations of function graphs, and applications of power functions. Construction highlights involve using GeoGebra commands to create points A, B, and pic1, defining variables a, c, b, d, and displaying text with text1. Suitable for high school mathematics teaching, helping students understand the integration of function transformations and geometric constructions.
GeoGebra Commands & Parameters
Point A(-3.0, 0.0)Point B(10.55, 0.0)Numeric a(-1.3)Numeric c(-4.45)Numeric b(7.6)y = (a * x^(2)) + (b * x) + c
AI Drawing Prompt Reference
Draw a coordinate plane with a parabola opening upward, with its vertex above the x-axis and two intersections with the x-axis. Place a circle to the left of the parabola, with its center below the x-axis, touching or crossing the parabola. To the right of the parabola, draw a logarithmic curve that rises from below the x-axis and crosses it. Draw a horizontal dashed line through the vertex as the axis of symmetry. Mark two points at the parabola's x-intercepts and one point above the parabola indicating the extremum. The overall figure demonstrates the integration of function transformations and geometric constructions, suitable for high school teaching.
The prompt above was compiled from the original drawing commands and is for reference only.