
Growth/Decay Model
Loading the math board and drawing, please wait…
In collections
Exponential functions
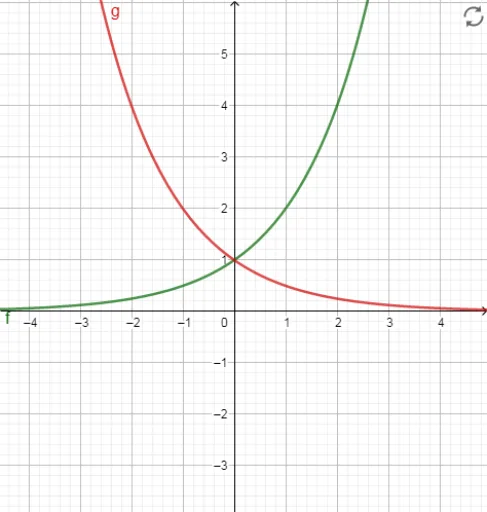
This example demonstrates mathematical models of growth and decay, showcasing dynamic function changes. Key concepts include exponential and logarithmic functions, growth rates, and decay rates. Constructed using GeoGebra objects f, g, it visualizes function models suitable for high school and above, illustrating real-world applications of mathematical functions.
GeoGebra Commands & Parameters
f: y = 2^(x)g: y = (1 / 2)^(x)
AI Drawing Prompt Reference
Draw a function graph demonstrating growth and decay models, including two key functions: one for exponential growth and one for exponential decay, with a slider to dynamically show their changes, suitable for high school and above mathematics learning, used to understand real-world applications of mathematical function models.
The prompt above was compiled from the original drawing commands and is for reference only.