
Interactive Demonstration of Isosceles Triangles and Function Graphs
Loading the math board and drawing, please wait…
In collections
Exponential functions
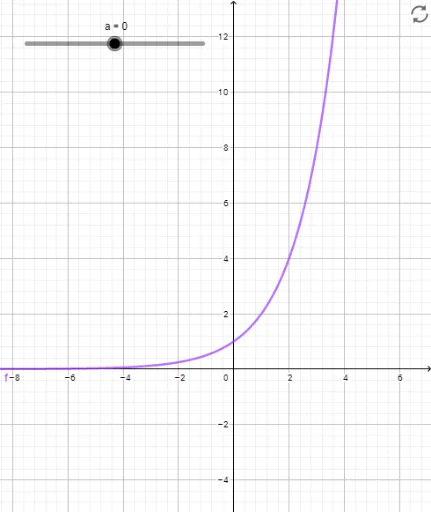
This example dynamically illustrates the geometric properties of isosceles triangles and their interaction with function graphs. It involves core math concepts like triangle properties, function graphing, coordinate geometry, and parametric equations. Constructed using GeoGebra commands/object 'a' (control point) and 'f' (function definition), it is suitable for high school mathematics education to visually connect geometry and algebra.
GeoGebra Commands & Parameters
Numeric a(0)f(x) = 2^(x + a)
AI Drawing Prompt Reference
Draw an interactive demonstration showing the geometric properties of isosceles triangles and their interaction with function graphs, including a control point and a function graph that shifts based on the control point, illustrating the dynamic changes in the triangle and function graph, suitable for high school mathematics education to connect geometry and algebra.
The prompt above was compiled from the original drawing commands and is for reference only.