
Growing Hair - Task
Loading the math board and drawing, please wait…
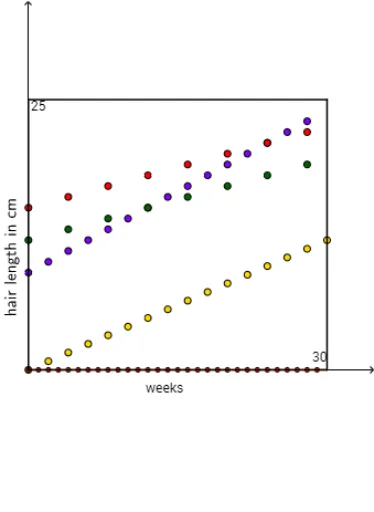
This example demonstrates the growth of hair, involving piecewise functions and stochastic processes. Using GeoGebra commands such as Polygon, Intersect, If, Root, etc., it dynamically shows the growth trajectory of hair. Suitable for high school mathematics education, particularly for learning functions and probability statistics.
GeoGebra Commands & Parameters
Polygon((0, 0), (0, 25), (30, 25), (30, 0)) → poly1, f, h, i, jIntersect(g, h) → BIf(x(B) < 30, x(B), 30) → l_1Root(g, 0) → CIf(x(C) < 0, x(D), x(C)) → lRotateText("hair length in cm", 90°) → text4Sequence(((2 * i), 9 + i), i, 0, 14) → list3Sequence(((4 * i), 15 + i), i, 0, 7) → list4Sequence(((4 * i), 12 + i), i, 0, 7) → list1Sequence(((2 * i), (0.8 * i)), i, 0, 15) → list2Textfield(deltax) → InputBox1Textfield(initial) → InputBox2Textfield(change) → InputBox3Textfield(g) → InputBox4Sequence(((deltax * i), initial + (change * i)), i, 0, 29) → list5Sequence(Segment[A + ((deltax * i), (change * i)), A + ((deltax * (i + 1)), (change * i))], i, 0, 29) → list7Sequence(Segment[A + ((deltax * (i + 1)), (change * i)), A + ((deltax * (i + 1)), (change * (i + 1)))], i, 0, 29) → list6TableText({{p, k, l, k_1, k_2}, {A2, B2, C2, D2, E2}, {A3, B3, C3, D3, E3}, {A4, B4, C4, D4, E4}, {A5, B5, C5, D5, E5}, {A6, B6, C6, D6, E6}, {A7, B7, C7, D7, E7}, {A8, B8, C8, D8, E8}, {A9, B9, C9, D9, E9}, {A10, B10, C10, D10, E10}}, "|_r") → text6
AI Drawing Prompt Reference
Draw a coordinate plane with a rectangular region extending upward from the origin, representing a scalp cross-section. Inside the rectangle, from a starting point near the bottom, draw multiple slanted line segments forming hair growth trajectories, each composed of alternating horizontal and vertical small steps to simulate random growth. On the left side of the rectangle, place a vertical reference line, and at the top, a horizontal line to limit growth. Below the rectangle, include a table listing several rows of data with columns for probability, length, and other parameters. Add several input boxes nearby for adjusting growth rate, initial length, and change amount. The overall graphic shows the dynamic process of hair length changing over position or time, with elements of function curves and probability statistics.
The prompt above was compiled from the original drawing commands and is for reference only.