
Graphs of Tangent and Cotangent by Malin Christersson
Loading the math board and drawing, please wait…
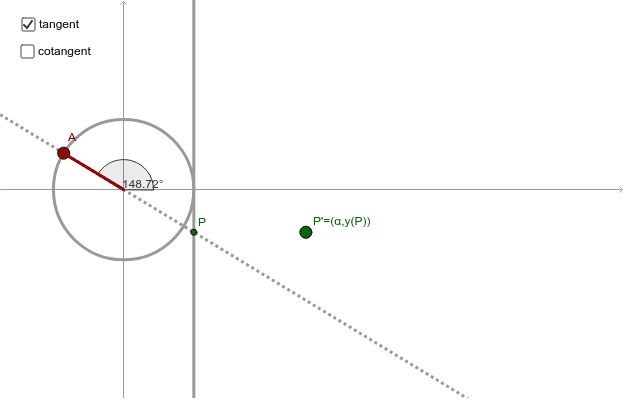
This example demonstrates the graphs of tangent and cotangent functions by dragging a red point. It illustrates the basic properties of trigonometric functions, such as periodicity and odd-even properties. Using GeoGebra commands like Intersect, Circle, Angle, and Line, the characteristics of these functions' graphs can be visually understood. Suitable for high school mathematics education and learning.
GeoGebra Commands & Parameters
Intersect(xAxis, yAxis) → OPoint(xAxis) → BCircle(O, B) → cPoint(c) → AAngle(B, O, A) → αSegment(A, O) → aLine(O, A) → eIntersect(b, e) → PIntersect(d, e) → Q
AI Drawing Prompt Reference
Draw the graphs of tangent and cotangent functions, demonstrating their basic properties such as periodicity and odd-even nature by dragging a red point. Start by drawing the intersection point O of the x-axis and y-axis, then take a point B on the x-axis, and draw a circle c with O as the center and B as the radius. On circle c, take a point A, and construct angle α with O and A. Then, draw line segment a from O to A and a line e through O. The intersections of line e with circle c are points P and Q.
The prompt above was compiled from the original drawing commands and is for reference only.