
Graphs of Sine and Cosine Functions
Loading the math board and drawing, please wait…
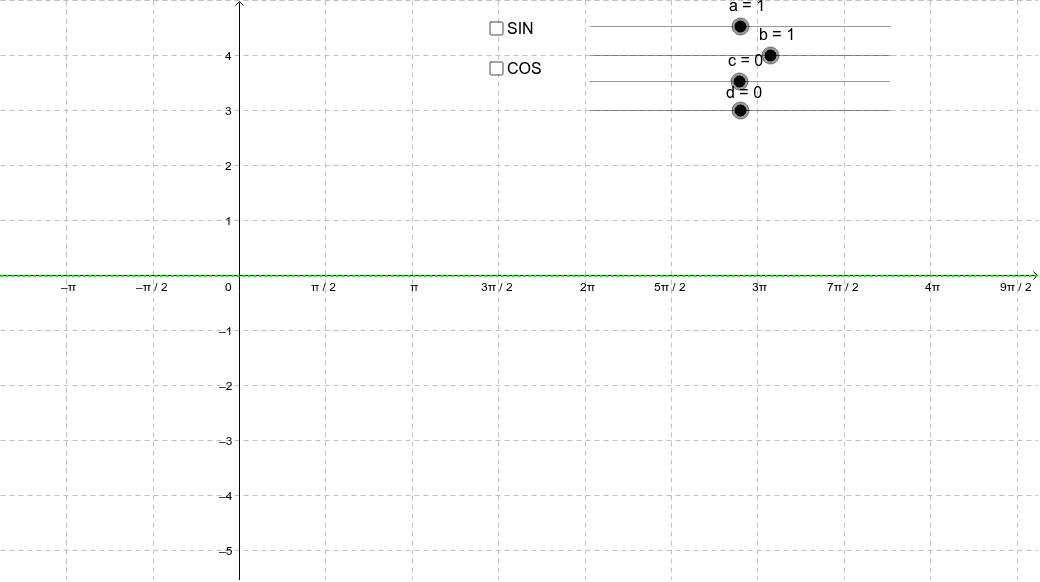
This example demonstrates the graphs of sine and cosine functions, highlighting their periodicity, amplitude, phase shifts, and symmetry. It utilizes GeoGebra commands like sliders (a, b, c, d), functions (f, g), text objects (text1, text2), and other elements (e, h, i) to construct and analyze the graphs. Ideal for high school trigonometry instruction to visualize and understand the properties of these fundamental functions.
GeoGebra Commands & Parameters
Numeric a(1.0)Numeric b(1.0)Numeric c(0.0)Numeric d(0.0)f(x) = a * sin(b * (x - c)) + dg(x) = a * cos(b * (x - c)) + dBoolean e(false)Boolean h(false)y = d