
Graphs of Logarithmic Functions with Different Bases
Loading the math board and drawing, please wait…
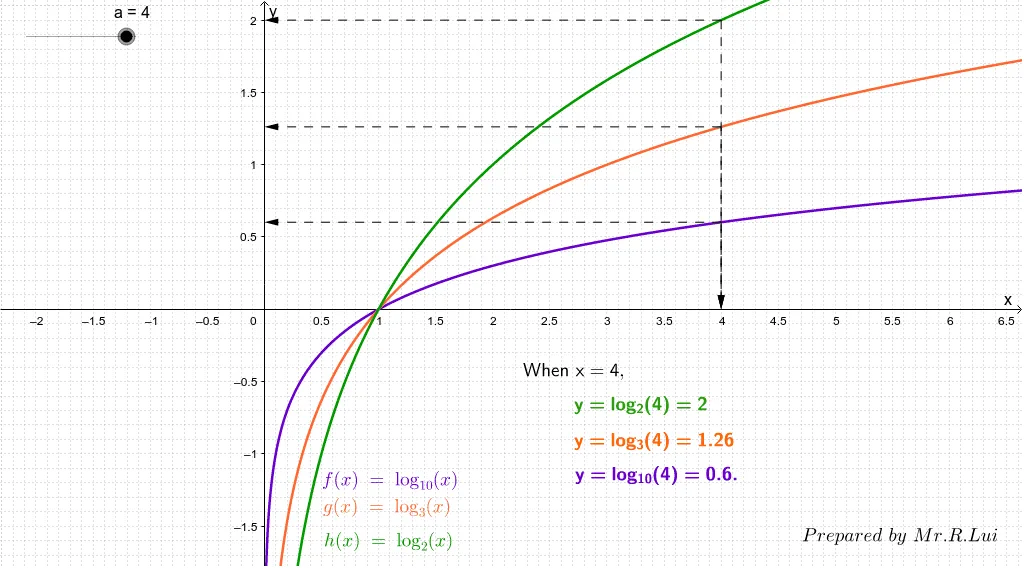
① This GeoGebra example demonstrates the graphs of logarithmic functions with varying bases, showing how the curve's shape and position change as the base value is adjusted. ② Core mathematical concepts include the definition of logarithmic functions, the effect of the base on monotonicity and vertical asymptote, the symmetry between logarithmic and exponential graphs, and parameter-driven transformations. ③ Construction details: The example uses GeoGebra commands such as Vector for constructing auxiliary vectors and Text for labeling; objects include functions f, g, h, points A, A1, A2, A3, B1, B2, B3, and variables a, b, c, u, v, w, z, allowing dynamic adjustment of bases via sliders or input fields. ④ Suitable for high school or introductory college students learning properties of logarithmic functions, and useful for classroom demonstrations or self-guided exploration of how base changes affect the graph.
GeoGebra Commands & Parameters
Vector(A3, B3) → uVector(A2, B2) → vVector(A1, B1) → wVector(A3, A) → zVector(A2, A) → bVector(A1, A) → cText(f(a)) → text1Text(a) → text2Text(g(a)) → text5Text(h(a)) → text7
AI Drawing Prompt Reference
Draw logarithmic function graphs with varying bases to show how the curve shape and position change. Include three function graphs, dynamically adjust the base via a slider to observe changes. Label the function values and base, and draw auxiliary vectors to represent relationships between functions.
The prompt above was compiled from the original drawing commands and is for reference only.