
Graphs of Hyperbolic and Exponential Functions
Loading the math board and drawing, please wait…
In collections
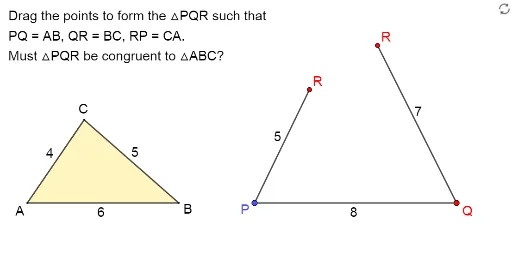
Exploring the Conditions for Congruence of 2 Triangles
This example demonstrates the graphs and properties of hyperbolic and exponential functions. Key mathematical concepts include hyperbolic functions, exponential functions, and geometric construction. Using GeoGebra commands such as Intersect, Segment, and Point, the dynamic display of these functions' graphs and characteristics is shown. Suitable for high school mathematics education and learning.
GeoGebra Commands & Parameters
Intersect(Circle[D, 4], Circle[E, 5], 1) → FSegment(F, D) → kSegment(E, F) → jPoint(Sequence[A + (i, 0), i, 1, 20, 1]) → BSequence(A + (i * UnitVector[Segment[A, C1]]), i, 1, 20, 1) → VPointsDynamicCoordinates(C1, x(ClosestPoint[VPoints, C1]), y(ClosestPoint[VPoints, C1])) → CSegment(A, C) → fSegment(A, B) → gSequence(B + (i * UnitVector[Segment[B, C2]]), i, 1, 20, 1) → UPointsDynamicCoordinates(C2, x(ClosestPoint[UPoints, C2]), y(ClosestPoint[UPoints, C2])) → C'Segment(C', B) → hIntersect(Circle[A, f], Circle[B, h], 1) → GPolygon({A, B, G}) → t1If(C ≟ G ∧ C' ≟ G, true, false) → closed1Vector(B, C2) → vVector(A, C1) → uSegment(D, E) → iPolygon(D, E, F) → t3, l, m, nIntersect(Circle[A, f], Circle[B, h], 2) → G'If(C ≟ G' ∧ C' ≟ G', true, false) → closed2Polygon({A, B, G'}) → t2
AI Drawing Prompt Reference
Create a coordinate-plane diagram showing constructions related to hyperbolic/exponential function behavior using circular intersections. Start with a point A, generate a sequence of points in the horizontal direction to define a set VPoints, and define a dynamic point C as the closest point from VPoints to a fixed reference point C1; draw the segment from A to C. Similarly, generate a sequence from B along another horizontal direction to define UPoints, define a dynamic point C' as the closest point from UPoints to a fixed reference point C2, and draw segment from B to C'. Construct two circles centered at A and B with radii equal to AC and BC' respectively, find their intersection point G, and draw the polygon formed by A, B, and G. Repeat the circle intersection using the alternative intersection radius to obtain a second intersection point G', and draw the polygon A, B, and G' to illustrate the second closed configuration.
The prompt above was compiled from the original drawing commands and is for reference only.