
Graphs of Exponential Functions (Rate of Increase)
Loading the math board and drawing, please wait…
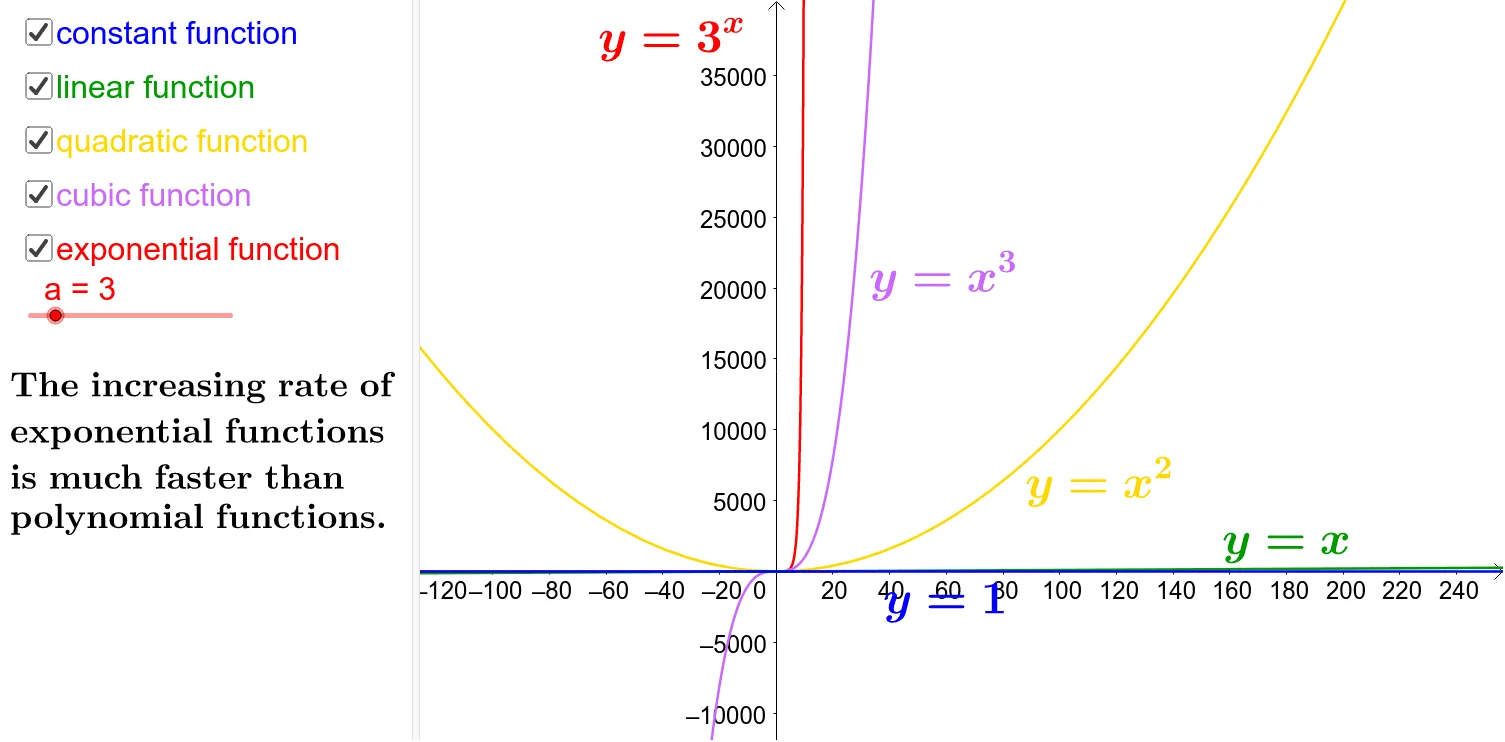
This example demonstrates the trends and rate of increase of exponential function graphs as the base changes. Key math concepts include exponential function properties, the relationship between derivatives and growth rates, and graph characteristics. GeoGebra commands/objects like a, f, text1, c, b_3, b_5, b_4, g, b_2, b_1, j, k, text2, text3, text4, text5, text6 are used for function definition, graph plotting, text labeling, and dynamic visualization. Suitable for high school mathematics teaching to understand exponential growth patterns and parameter effects.
GeoGebra Commands & Parameters
Numeric a(2.0)f(x) = a^(x)y = x^(2)Boolean b_3(true)Boolean b_5(true)Boolean b_4(true)g: y = x^(3)Boolean b_2(true)Boolean b_1(true)y = xy = 1
AI Drawing Prompt Reference
Plot the graphs of exponential functions to demonstrate how the rate of increase changes with different bases. Include basic exponential functions like y = 2^x and power functions such as y = x^2, along with reference lines like y = x^3, y = x, and y = 1. Dynamically adjust the base to observe the changes in the graphs, and label key points and mathematical concepts like growth rates, derivatives, and function characteristics with text annotations, suitable for high school mathematics teaching to understand exponential growth patterns and parameter effects.
The prompt above was compiled from the original drawing commands and is for reference only.