
Graphs of Exponential Functions: Anatomy and Investigation
Loading the math board and drawing, please wait…
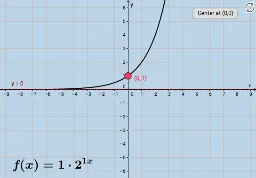
This example demonstrates the construction and investigation of exponential function graphs, showing how parameters a and k affect the shape, while c and d cause translations. Core math concepts include exponential function properties, parameter influence, and graph transformations. GeoGebra commands and objects like Textfield, sliders, and input boxes are used to create interactive elements. Suitable for high school mathematics education to help students understand the transformation rules of exponential function graphs.
GeoGebra Commands & Parameters
Textfield(a) → InputBox1Textfield(c) → InputBox2Textfield(k) → InputBox3Textfield(d) → InputBox5
AI Drawing Prompt Reference
Draw the graph of an exponential function, showing how parameters a and k affect its shape, and how c and d cause translations. Use sliders to control the values of a, k, c, and d, and display their current values next to the graph. Start with the basic exponential function graph, then adjust it based on the slider values, and finally add text labels next to the graph explaining the effect of each parameter.
The prompt above was compiled from the original drawing commands and is for reference only.