
Logarithmic Function Graphs
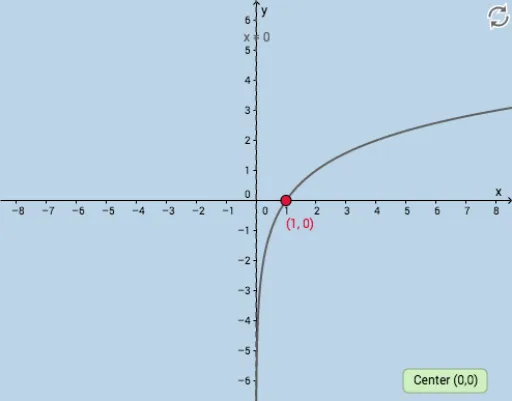
Loading the math board and drawing, please wait…
This example demonstrates the plotting and behavior of logarithmic function graphs, focusing on parameter influences. Key math concepts include logarithmic function definitions, graph characteristics, and the effects of parameters k, c, d. Constructed using GeoGebra commands like Textfield, Slider, InputBox, function objects, and buttons for dynamic visualization. Suitable for high school mathematics education to understand logarithmic function properties and parameter effects.
GeoGebra Commands & Parameters
Textfield(a) → InputBox1Textfield(c) → InputBox2Textfield(k) → InputBox3Textfield(d) → InputBox5
AI Drawing Prompt Reference
Create a graph demonstrating logarithmic functions, featuring sliders for parameters k, c, and d, and an input box for parameter a, showing how these parameters influence the graph's characteristics, with text boxes displaying parameter values to observe their effects on the function graph.
The prompt above was compiled from the original drawing commands and is for reference only.