
Graphs of Arithmetic Sequence
Loading the math board and drawing, please wait…
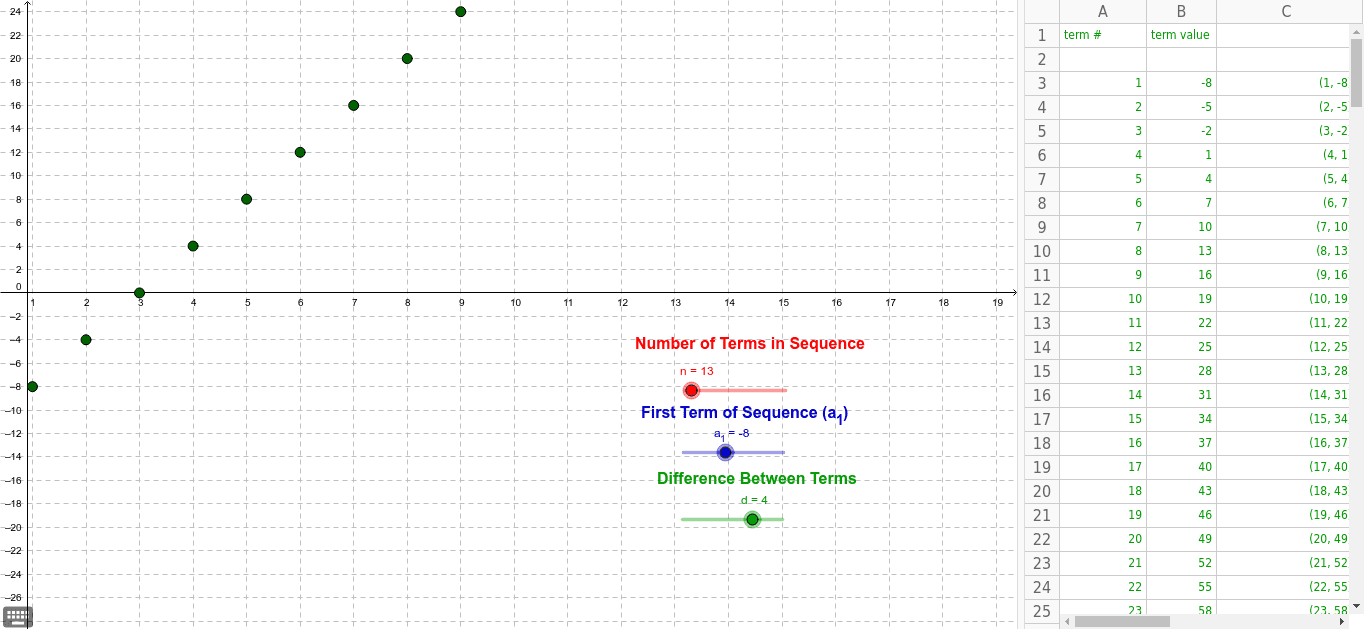
This example demonstrates the graphing of arithmetic sequences on a coordinate plane, illustrating key mathematical concepts such as sequences, coordinate geometry, and function visualization. The construction leverages GeoGebra commands like Sequence, d (common difference), a_1 (first term), n (number of terms), and points A1-A19, B1-B19, and list1 for dynamic plotting. It is suitable for high school mathematics education, aiding students in understanding the relationship between sequences and function graphs while mastering dynamic graphing techniques.
GeoGebra Commands & Parameters
Sequence((c, (d * (c - 1)) + a_1), c, 1, n) → list1
AI Drawing Prompt Reference
Plot the graph of an arithmetic sequence in a coordinate plane, showing the first n terms where the first term is a_1 and the common difference is d. Use dynamic points to mark the position of each term and connect them to form a curve, visually demonstrating the relationship between the sequence and the function graph, suitable for high school mathematics education to help students understand the connection between sequences and function graphs as well as dynamic graphing techniques.
The prompt above was compiled from the original drawing commands and is for reference only.