
Graphs and Correspondence Rules-2
Loading the math board and drawing, please wait…
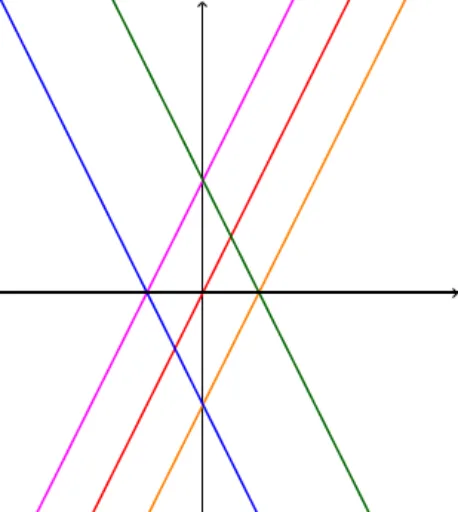
This example demonstrates the correspondence rules between 3D solids and 2D graphs through rotation, transformation, and linear equations. Core math concepts include rotation, solid geometry, linear equations, statistical characteristics, and diagrams. GeoGebra commands like LaTeX, TableText, and Textfield, along with objects such as f_1 to f_18, p_1 to p_6, InputBoxes 5 to 9, and variables a to e, are used to construct function graphs, text inputs, and parameter controls. Suitable for high school students learning solid geometry, coordinate geometry, and function graphing to understand spatial transformations and correspondence rules.
GeoGebra Commands & Parameters
LaTeX(f_1, true, true) → text9LaTeX(f_4, true, true) → text10LaTeX(f_6, true, true) → text11LaTeX(f_7, true, true) → text12LaTeX(f_8, true, true) → text13TableText({{text9}, {text14}, {text15}, {text10}, {text16}, {text11}, {text12}, {text13}, {text17}}, "|_l") → text18Textfield(p_1) → InputBox5Textfield(p_2) → InputBox6Textfield(p_3) → InputBox7Textfield(p_4) → InputBox8Textfield(p_6) → InputBox9
AI Drawing Prompt Reference
Draw a 3D solid and its corresponding 2D projection. First, draw solids f_1 to f_18, then use rotation and linear equations to show their correspondence. Control the shape and position of the solids with InputBoxes 5 to 9 for parameters a to e. On the 2D plane, draw the projections of f_1 to f_8 and use text input boxes to display their equations.
The prompt above was compiled from the original drawing commands and is for reference only.