
Graphs and Correspondence Rules-1 Task
Loading the math board and drawing, please wait…
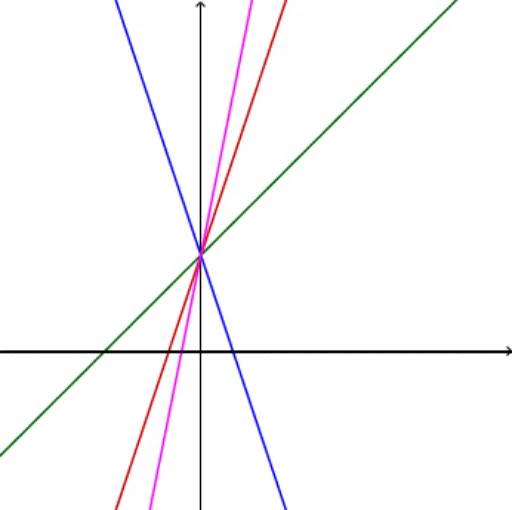
This example demonstrates how to plot graphs using parametric equations and show their correspondence. Core math concepts include parametric equations, coordinate geometry, and function graphing. It utilizes commands like LaTeX, TableText, and Textfield, along with objects such as g_1, g_3, g_4, g_6, text elements, and input boxes for interactive exploration. Suitable for high school students learning parametric equations, function graphs, and analytical geometry.
GeoGebra Commands & Parameters
LaTeX(g_1, true, true) → text2LaTeX(g_3, true, true) → text3LaTeX(g_4, true, true) → text4LaTeX(g_6, true, true) → text5LaTeX(g_2, true, true) → text6LaTeX(g_5, true, true) → text7TableText({{text2}, {text6}, {text3}, {text4}, {text7}, {text5}}, "|_l") → text8Textfield(p) → InputBox1Textfield(p_1) → InputBox2Textfield(p_2) → InputBox3Textfield(p_3) → InputBox4
AI Drawing Prompt Reference
Plot two graphs defined by parametric equations and display their correspondence. Label each graph with its parametric equation using text elements, and arrange all equations in a table below. Provide four input boxes for users to enter parameter values to dynamically adjust the graphs.
The prompt above was compiled from the original drawing commands and is for reference only.