
Graphing Trigonometric Surfaces and Points
Loading the math board and drawing, please wait…
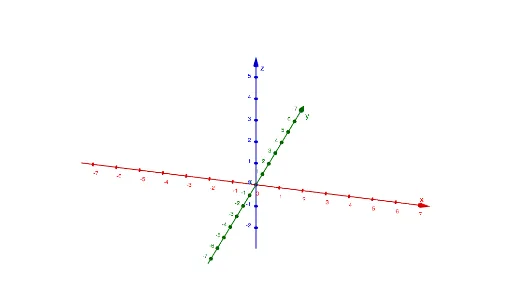
This GeoGebra example demonstrates how to plot three-dimensional trigonometric surfaces and position geometric points on them using vector operations and orthocenter constructions. It integrates histogram visualization to analyze point distribution patterns. Core mathematical concepts include trigonometric functions, surface parametrization, vector algebra, orthographic projection, and integral-based statistics. Construction involves GeoGebra's surface plotting tools, vector commands, orthocenter construction utilities, and histogram generation features, supporting interactive parameter adjustment and real-time observation. Ideal for high school space geometry, college calculus, and analytic geometry courses, it helps learners visualize multi-variable functions and connect geometric constructions with functional representations.
AI Drawing Prompt Reference
Draw a three-dimensional trigonometric surface and place points on it. Use vector operations to position the points, then project them onto a plane using orthogonal projection. Finally, generate a histogram to show the distribution of the points.
The prompt above was compiled from the original drawing commands and is for reference only.