
Graphing the First Derivative
Loading the math board and drawing, please wait…
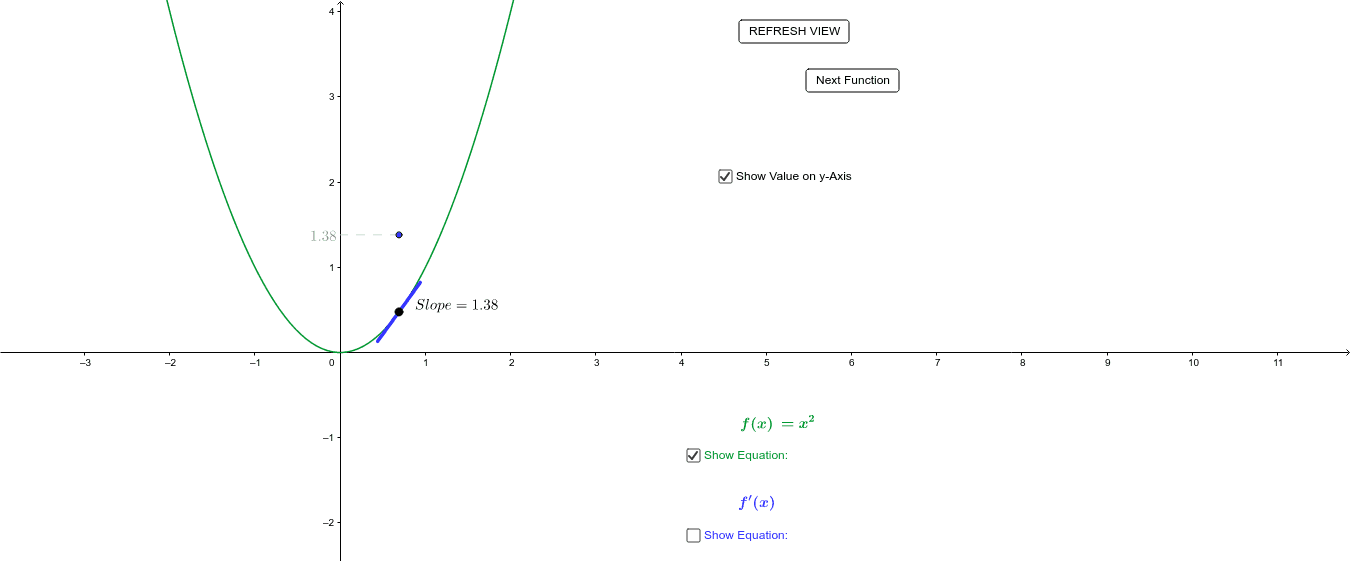
This example demonstrates how to graph the first derivative of a function. It involves core math concepts like derivatives, slopes, and function graphs. Construction highlights include using GeoGebra commands/objects: Point, Tangent, Slope, Segment. Suitable for high school mathematics teaching or self-learning to understand the relationship between the derivative and the original function's graph.
GeoGebra Commands & Parameters
Point(f) → ATangent(A, f) → aSlope(a) → slopeSegment(D, B) → hSegment((x(A) - 0.25, y(A) - (0.25 * g(x(A)))), (x(A) + 0.25, y(A) + (0.25 * g(x(A))))) → Slope_1