
Graphing the Derivative by Jan Mays
Loading the math board and drawing, please wait…
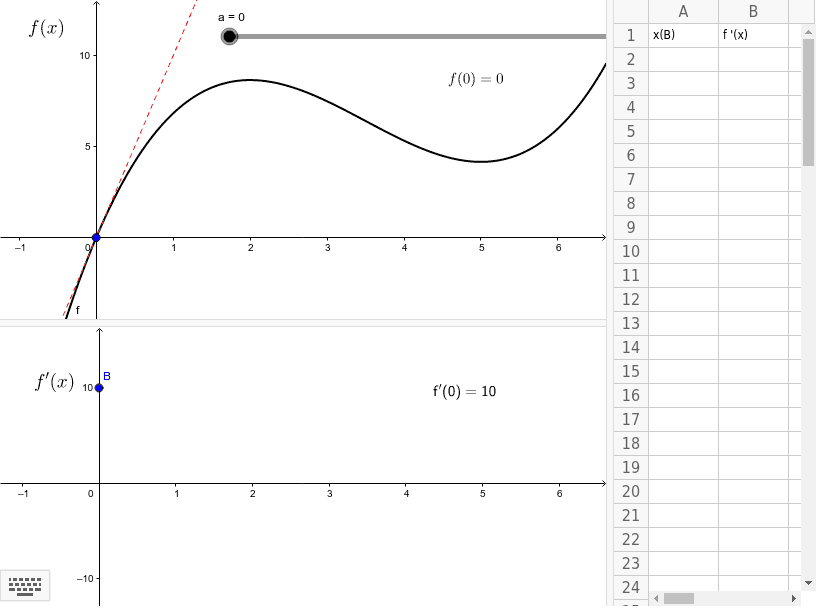
This example demonstrates how to graph the derivative of a function, visually showing properties like monotonicity and extrema. Core math concepts include derivatives, linear functions, exponentials, fractions, ellipses, and logarithms. It uses GeoGebra commands like Tangent, f, a, A, b, c, B, C1_1, D1_1, B1_1, C1_2, A1_1, B1_2, B1_3, text2, text3, d, text1, text4, B1_4, A1, B1. Suitable for high school and above students learning calculus or for teaching the geometric meaning of derivatives.
GeoGebra Commands & Parameters
Tangent(A, f) → c
AI Drawing Prompt Reference
Draw a function curve and its tangent line at a selected point to illustrate the geometric meaning of the derivative. The function should be smooth, possibly combining linear, exponential, fractional, elliptical, and logarithmic elements. Choose a point on the curve, then draw a tangent line that touches the curve exactly at that point and extends on both sides. The slope of the tangent should visually indicate the function's monotonicity and extrema. Label the point and the tangent, and add brief text explaining the relationship between the derivative and the tangent slope. The overall layout should be clear, suitable for high school and above students learning calculus.
The prompt above was compiled from the original drawing commands and is for reference only.