
Graphing Quadratic Functions by Garret Cahill (4)
Loading the math board and drawing, please wait…
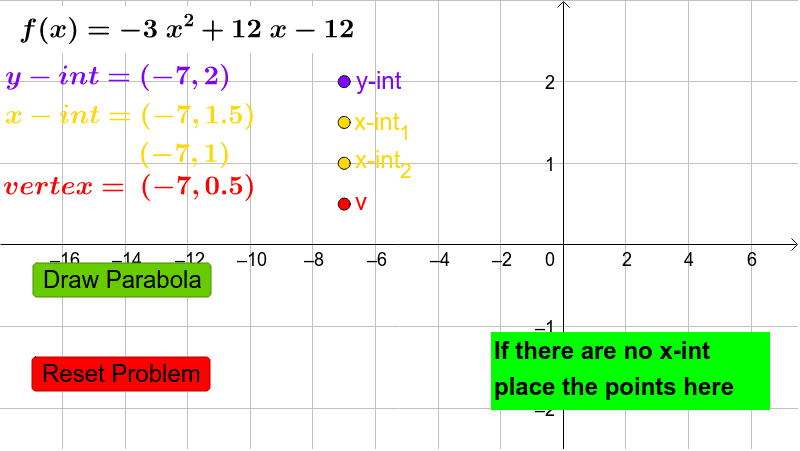
This example demonstrates how to graph quadratic functions by inputting coefficients, showing key features like vertex, x-intercepts, and discriminant. Core math concepts include quadratic functions, vertex coordinates, discriminant, and function graph transformations. It uses GeoGebra commands like Coefficients, If, Textfield, and objects such as f, Coeff, h, k, disc, x1, x2, etc. Suitable for high school students learning quadratic function graphing and properties analysis.
GeoGebra Commands & Parameters
Coefficients(f) → CoeffIf(disc ≥ 0, h + sqrt(disc) / 2, 1) → x1If(disc ≥ 0, h - sqrt(disc) / 2, 1) → x2Textfield(f) → InputBox1
AI Drawing Prompt Reference
Draw the graph of a quadratic function by inputting coefficients, showing the vertex, x-intercepts, and discriminant. Start with the function curve, mark the vertex, calculate and display the x-intercepts, and finally provide a text box for inputting the function coefficients.
The prompt above was compiled from the original drawing commands and is for reference only.