
Graphing Polynomials from Roots
Loading the math board and drawing, please wait…
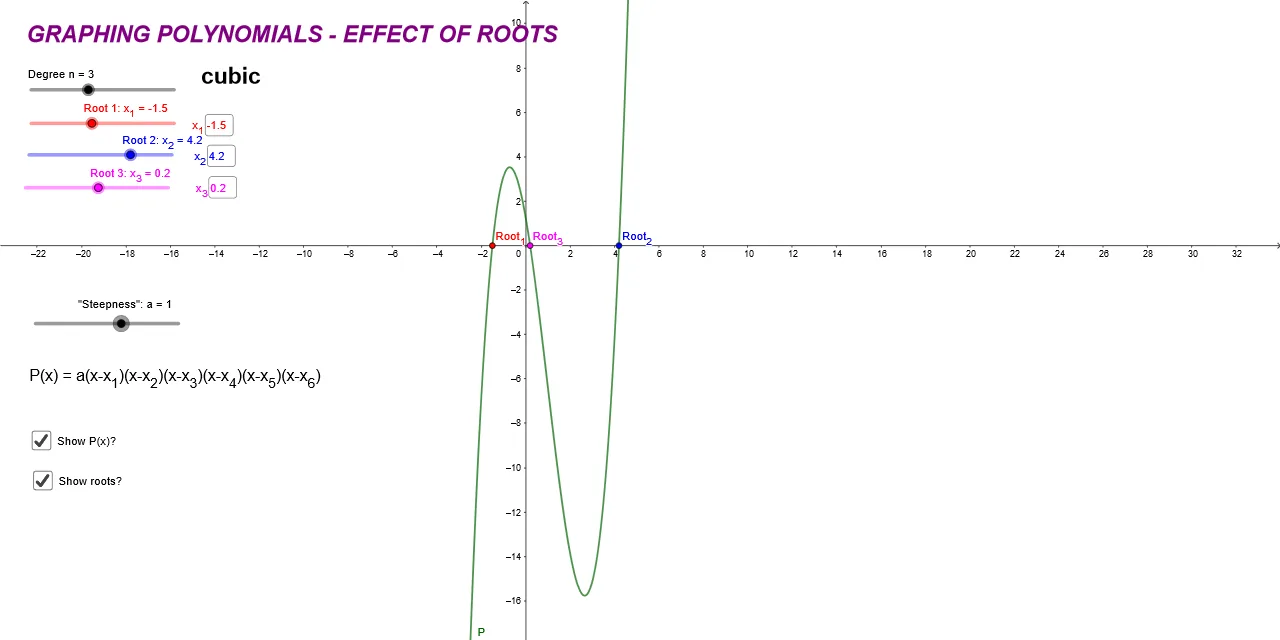
This example demonstrates how to graph polynomial functions using their roots. Key math concepts include polynomial functions, roots, and function graphing. GeoGebra commands/objects used: Textfield, x_{6}, x_{5}, x_{1}, x_{2}, x_{4}, a, x_{3}, n, P, InputBox1, InputBox2, InputBox3, InputBox4, InputBox5, InputBox6, text, text1, Root_{1}, Root_{2}, Root_{3}, Root_{4}, Root_{5}, Root_{6}, ShowFunction, text2, text3, text4, text5, text6, text7, ShowRoots. Suitable for high school mathematics teaching to understand the relationship between roots and graphs.
GeoGebra Commands & Parameters
Textfield(x_{1}) → InputBox1Textfield(x_{2}) → InputBox2Textfield(x_{3}) → InputBox3Textfield(x_{4}) → InputBox4Textfield(x_{5}) → InputBox5Textfield(x_{6}) → InputBox6
AI Drawing Prompt Reference
Draw the graph of a sixth-degree polynomial function with roots x1, x2, x3, x4, x5, and x6. First, input the value of each root, then construct the polynomial function based on these roots and display its graph and the positions of the roots.
The prompt above was compiled from the original drawing commands and is for reference only.