
Graphing Piecewise Functions Using Conditional Definitions
Loading the math board and drawing, please wait…
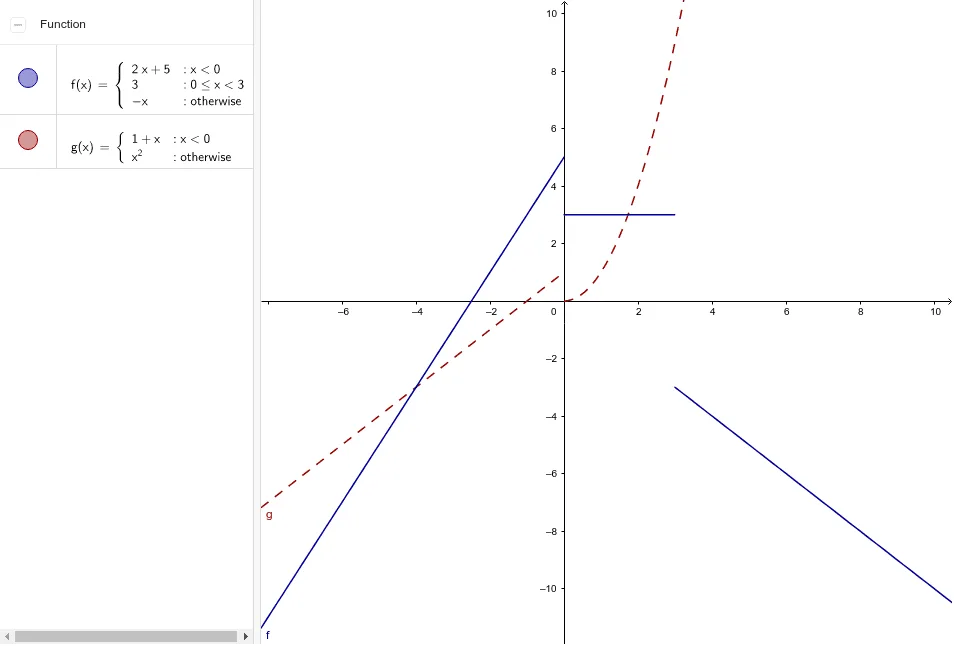
This example demonstrates how to draw a piecewise function graph by combining different function rules over different intervals in a single coordinate system. It highlights how the overall curve changes according to which input range is selected, making possible discontinuities and boundary behavior easy to visualize. Key mathematical concepts include piecewise functions, conditional expressions (If…Then logic), and graphing functions defined on real-number intervals. Construction in GeoGebra relies on the If command to choose between expressions: using the objects g and f, the graph is formed by selecting the appropriate formula based on the input’s condition, then displaying the resulting overall piecewise curve. Suitable for middle-to-high school instruction on functions and their graphs, and for early university preparation or self-study focused on modeling and interpreting piecewise-defined functions.
GeoGebra Commands & Parameters
If(x < 0, 1 + x, x^(2)) → gIf(x < 0, 2 * x + 5, If[x < 3, 3, -x]) → f
AI Drawing Prompt Reference
Draw a piecewise function graph. The graph consists of two parts: the left part is a parabola y = 1 + x, and the right part is a linear function y = 2x + 5. When x is less than 0, the graph shows the parabola; when x is greater than or equal to 0, the graph shows the linear function. The graph should clearly show the domain of the piecewise function and boundary behavior.
The prompt above was compiled from the original drawing commands and is for reference only.