
Graphing Linear Inequalities
Loading the math board and drawing, please wait…
In collections
学习 GeoGebra 经典应用
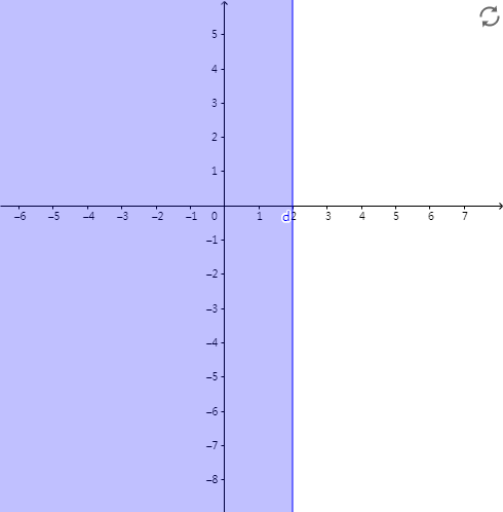
This example demonstrates how to graph linear inequalities. It involves the graphical representation of linear inequalities and the use of GeoGebra commands a, b, c, d. Suitable for students at the junior high school level and above to learn about linear inequalities and graphing techniques.
GeoGebra Commands & Parameters
Numeric a(1)Numeric b(1)Numeric c(3)d(x) = (a * x) + b ≤ c
AI Drawing Prompt Reference
Draw a graph of a linear inequality in the coordinate plane. Choose three numbers: the slope factor a, the intercept b, and the constant c. Using x as the variable, form the expression (a·x)+b and compare it to c to form the inequality (a·x)+b ≤ c. Display the solution set on the same plane, with the boundary given by the line (a·x)+b = c and the shading/line style indicating the “≤” condition.
The prompt above was compiled from the original drawing commands and is for reference only.