
Graphing Linear Equations: Slope & Intercept by Tim Brzezinski (2)
Loading the math board and drawing, please wait…
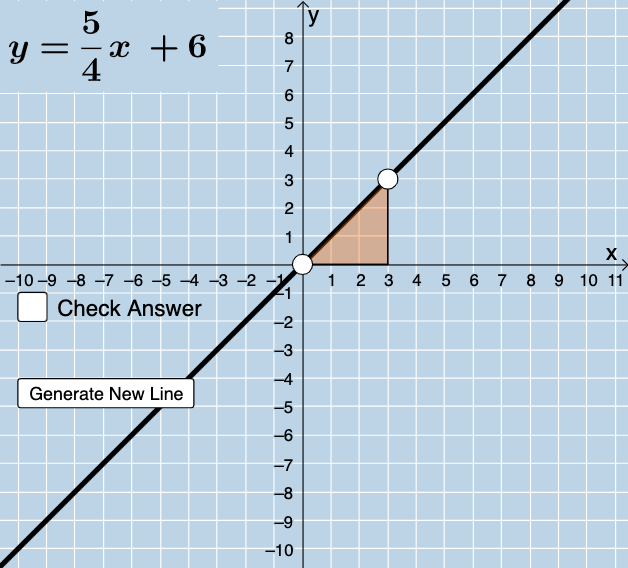
This example helps students graph linear equations using slope and intercept, providing instant feedback. It involves key math concepts such as linear equations and functions. Using GeoGebra commands like Sequence, Union, Random, Point, Line, etc., students can understand the construction points of linear equations. Suitable for middle school and above students to learn about linear equations and functions.
GeoGebra Commands & Parameters
Sequence(i, i, -10, -1) → a, {-10, -9, -8, -7, -6, -5, -4, -3, -2, -1}Sequence(i, i, -10, -1) → b, {-10, -9, -8, -7, -6, -5, -4, -3, -2, -1}Sequence(i, i, 1, 10) → c, {1, 2, 3, 4, 5, 6, 7, 8, 9, 10}Union(b, c) → dRandom(-12, 12) → ePoint(x = 0) → ALine(A, B) → gFractionText(Slope[f]) → text1FractionText(f(0)) → text2Intersect(p, eq1) → CPolygon(A, C, B) → t1, b_1, a_1, c_1Segment(A, C) → iSegment(C, B) → jSegment(B, A) → k
AI Drawing Prompt Reference
Create a graph illustrating how to plot a linear equation using slope and intercept. Generate two parallel sequences of numbers, one from -10 to -1 and the other from 1 to 10, and combine them. Connect the origin to a randomly chosen point to form a line. Select another random point on the line and display the slope of the line and the function value at that point. Finally, connect the origin to this point and draw a triangle to show the components of the line.
The prompt above was compiled from the original drawing commands and is for reference only.