
Graphing Linear Equations (II)
Loading the math board and drawing, please wait…
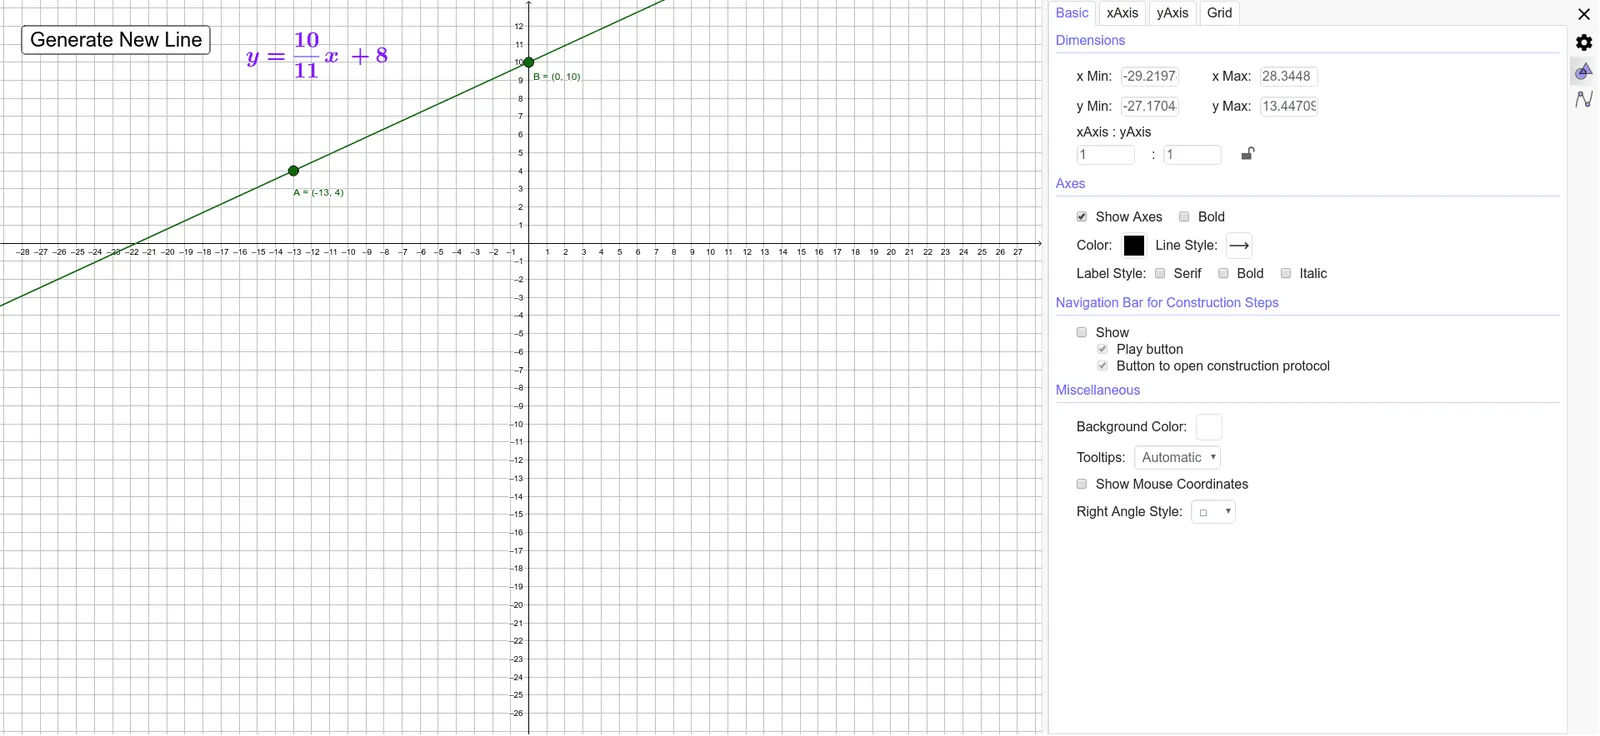
This example demonstrates how to use GeoGebra to graph linear equations. The key mathematical concepts involved are linear equations and functions. Using commands such as Sequence, Union, Random, Line, and FractionText, dynamic generation and display of linear equation graphs are achieved. Suitable for middle school and above students or teachers.
GeoGebra Commands & Parameters
Sequence(i, i, -20, -1) → aSequence(i, i, 1, 20) → cSequence(i, i, -20, -1) → bUnion(b, c) → dRandom(-12, 12) → eLine(A, B) → gFractionText(Slope[f]) → text1FractionText(f(0)) → text2