
Graphing Linear Equations (II) by ksiegel16
Loading the math board and drawing, please wait…
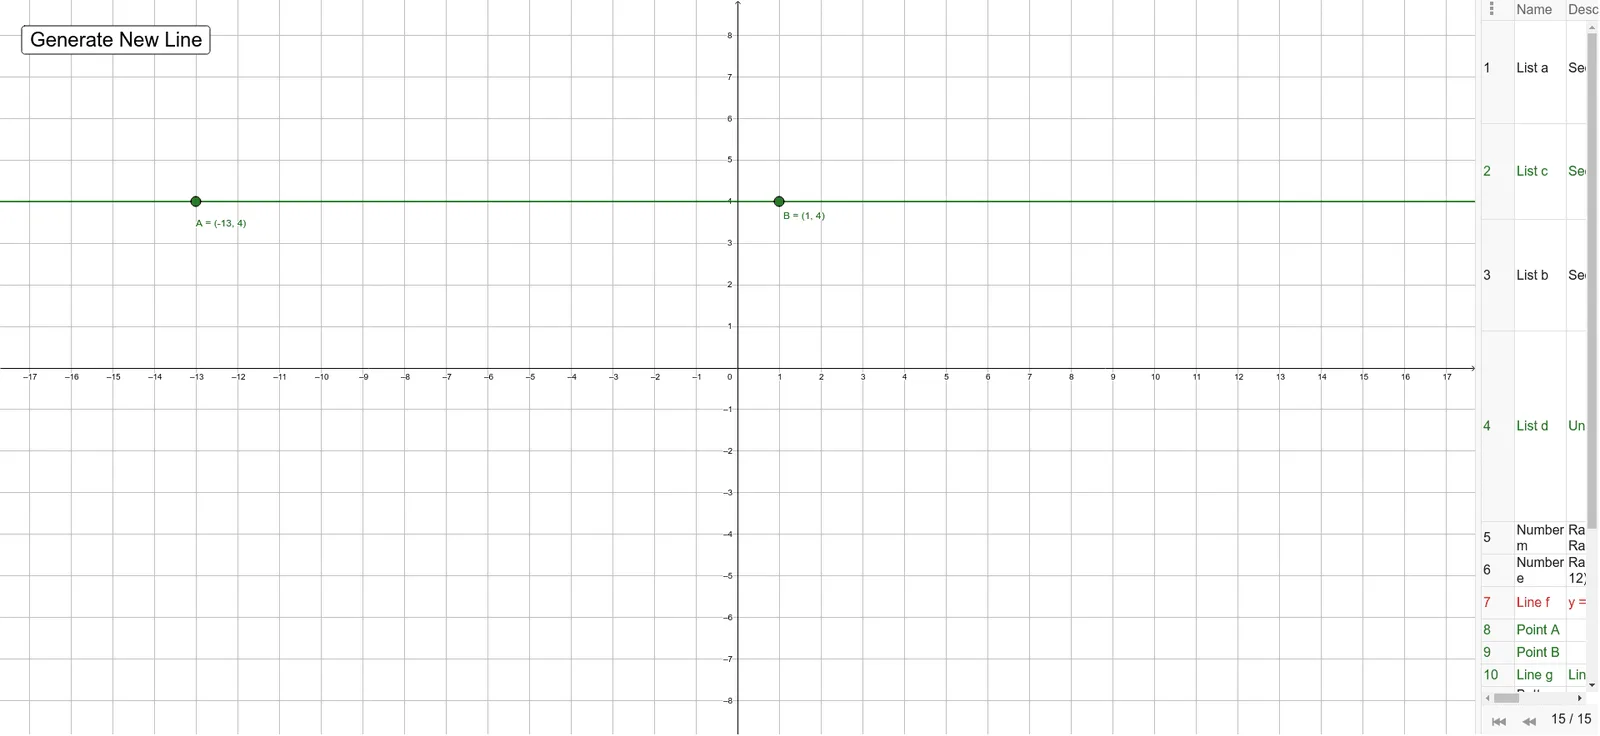
This example demonstrates how to graph and manipulate linear equations, equilateral triangles, step functions, and exponential functions using GeoGebra. Key math concepts include linear equations, coordinate geometry, sequences, function graphs, and transformations. It utilizes commands like Sequence, Union, Random, Line, and FractionText. Suitable for high school mathematics teaching or self-learning to understand function graphing and geometric transformations.
GeoGebra Commands & Parameters
Sequence(i, i, -20, -1) → aSequence(i, i, 1, 20) → cSequence(i, i, -20, -1) → bUnion(b, c) → dRandom(-12, 12) → eLine(A, B) → gFractionText(Slope[f]) → text1FractionText(f(0)) → text2
AI Drawing Prompt Reference
Create a graph demonstrating linear equations, equilateral triangles, step functions, and exponential functions, highlighting coordinate geometry and function graph transformations. Generate two sequences, one from -20 to -1 and another from 1 to 20, then merge them. Select a random point and draw a line connecting it to the merged sequence points. Display the slope and y-intercept of the line as fractional text.
The prompt above was compiled from the original drawing commands and is for reference only.