
Graphing Inequalities Practice: Visualizing Solution Sets
Loading the math board and drawing, please wait…
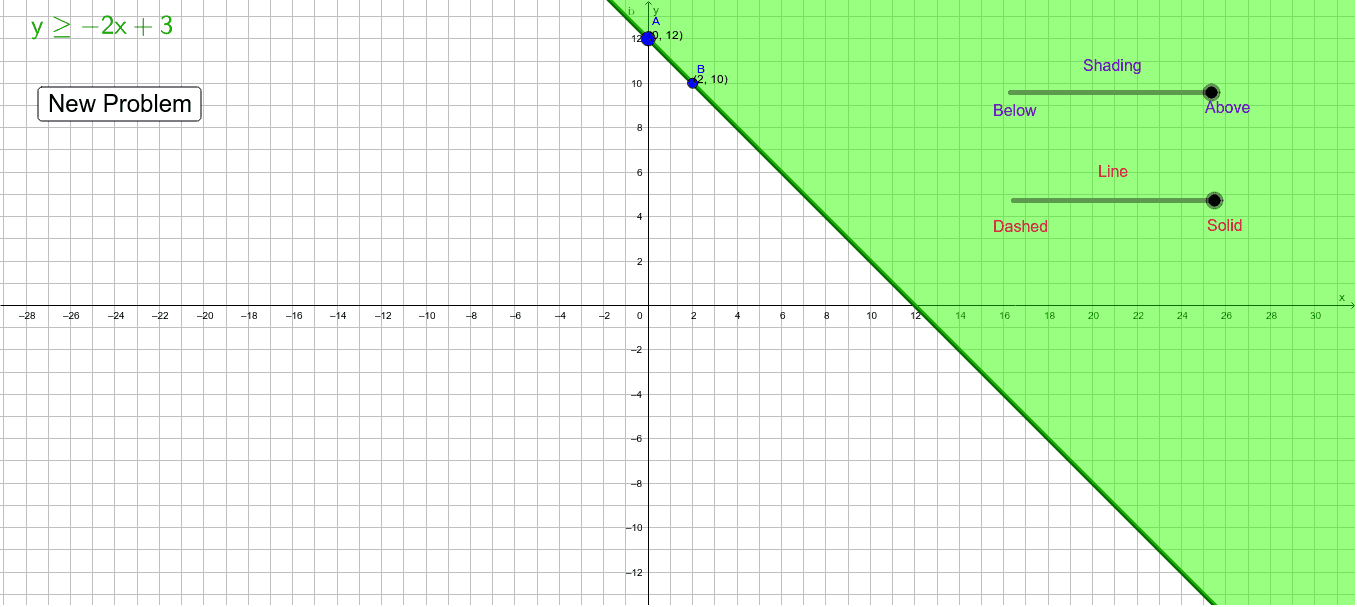
This example demonstrates graphing linear inequalities and shading solution regions on a coordinate plane. Core concepts include inequalities, slope calculation, and area shading. Construction utilizes GeoGebra commands like Sequence for random generation, Union for merging regions, Line for boundaries, Slope for gradient, and FractionText for display. Suitable for middle and high school students practicing inequality graphing and understanding solution sets visually.
GeoGebra Commands & Parameters
Sequence(i, i, -20, -1) → aSequence(i, i, 1, 20) → bUnion(a, b) → cRandom(-12, 12) → eRandom(1, 4) → symbolLine(A, B) → iLine(A, B) → jSlope(i) → slopeFractionText(m) → l