
Graphing Inequalities Practice
Loading the math board and drawing, please wait…
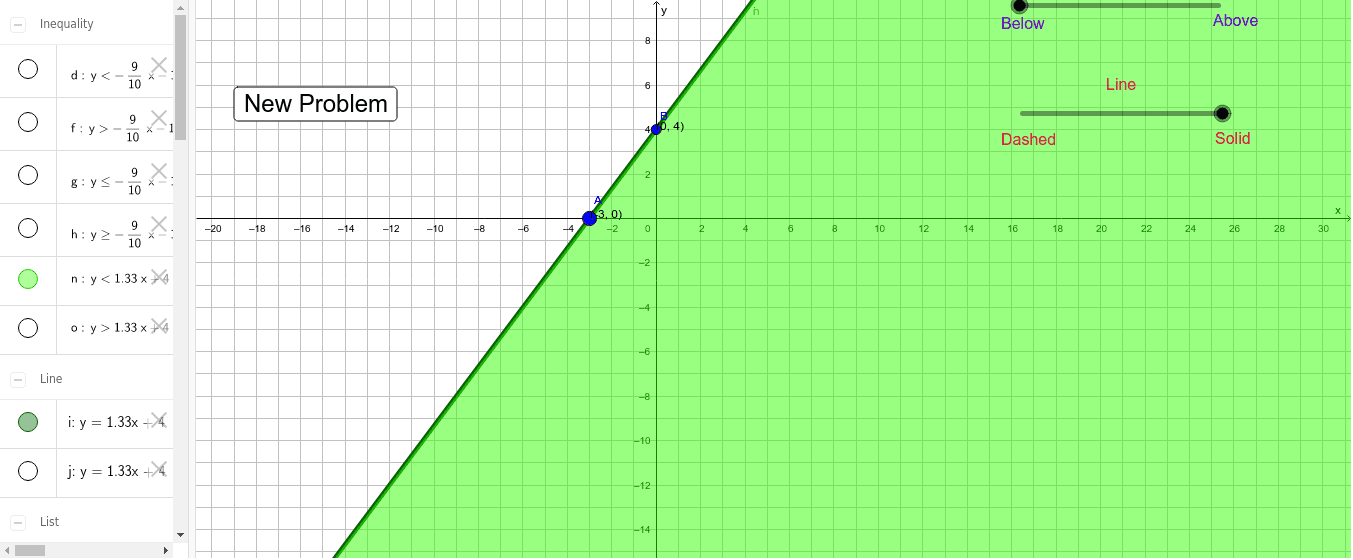
This example demonstrates how to graph inequality regions in a coordinate system. Key math concepts include inequalities, function graphs, and region representation. It utilizes GeoGebra commands and objects such as Sequence, Union, Random, Line, Slope, and FractionText. Suitable for high school students learning to graph inequalities and analyze function images.
GeoGebra Commands & Parameters
Sequence(i, i, -20, -1) → aSequence(i, i, 1, 20) → bUnion(a, b) → cRandom(-12, 12) → eRandom(1, 4) → symbolLine(A, B) → iLine(A, B) → jSlope(i) → slopeFractionText(m) → l
AI Drawing Prompt Reference
In a coordinate system, draw two lines and the region between them, with one line's slope expressed as a fraction, and randomly generate the intersection points and slopes of the lines, marking inequalities with different symbols to demonstrate key concepts of function graphs and inequality region representation.
The prompt above was compiled from the original drawing commands and is for reference only.