
Graphing Inequalities Practice by Terry Lee Lindenmuth
Loading the math board and drawing, please wait…
In collections
Geom. & Alg.: Systems Equations & Linear Programming
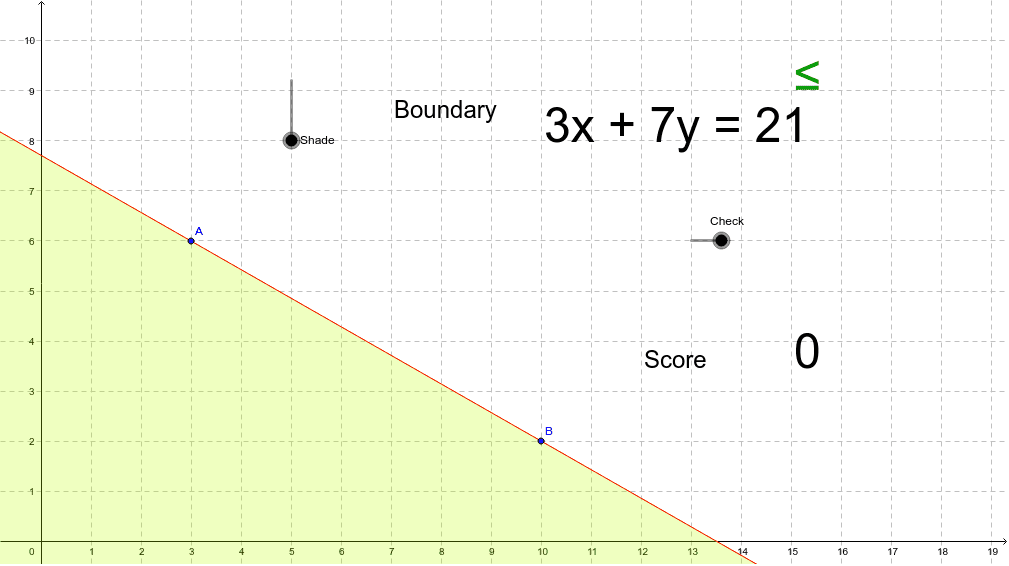
This example demonstrates how to graph inequalities and shade the correct regions in a coordinate plane. Core math concepts include inequalities, boundary lines, area shading, linear equations, and slope. It uses GeoGebra commands like Random, Line, Text, and If, with objects such as score, A, B, m, and Shade. Suitable for middle school and above students practicing analytical geometry and inequality graphing, or for classroom demonstrations.
GeoGebra Commands & Parameters
Random(1, 15) → deeRandom(1, 10) → seeLine(A, B) → aLine(C, D) → bText(score) → text1Text(b) → text3Random(0, 1) → updwnIf(updwn ≟ Shade, 1, 0) → ptshadeIf(a ≟ b, 1, 0) → ptline
AI Drawing Prompt Reference
Draw two randomly generated lines in a coordinate plane, labeling their slopes. Shade one of the line segments based on a random result, and display whether the slopes of the two lines are equal.
The prompt above was compiled from the original drawing commands and is for reference only.