
Graphing Inequalities Part 1
Loading the math board and drawing, please wait…
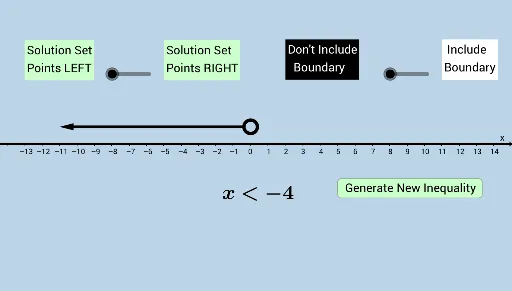
This example demonstrates how to graph inequalities in a coordinate system, involving core math concepts like inequalities, function graphs, symmetry, and geometric transformations. It utilizes GeoGebra commands such as Random, Point, DynamicCoordinates, and Vector. Ideal for high school students learning inequality graphing techniques.
GeoGebra Commands & Parameters
Random(-10, 10) → aPoint(b) → ARandom(1, 4) → eRandom(0, 1) → rDynamicCoordinates(A, round(x(A)), 1) → BVector((x(B) + 0.4, 1), (11, 1)) → uVector((x(B) - 0.4, 1), (-11, 1)) → v
AI Drawing Prompt Reference
Draw an inequality graph by first randomly generating a point A in the coordinate system, then creating two vectors u and v pointing in the positive and negative x-directions with a length of 11. Next, generate a dynamic point B with y-coordinate 1 based on the x-coordinate of point A. Finally, draw a function graph related to point A and vectors u and v to illustrate the geometric meaning of the inequality.
The prompt above was compiled from the original drawing commands and is for reference only.