
Graphing Inequalities by Rachel Fruin
Loading the math board and drawing, please wait…
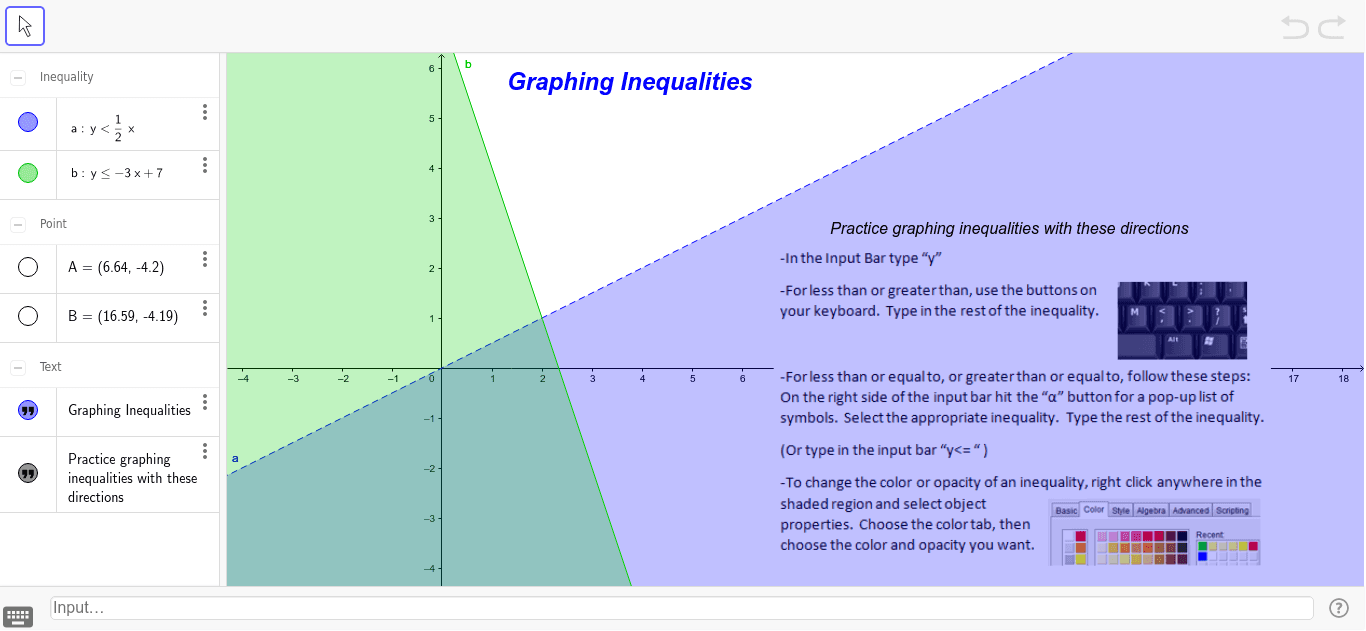
This example demonstrates how to graph inequalities using GeoGebra. Key mathematical concepts include inequalities, function graphs, and coordinate geometry. By adjusting parameters a and b, you can observe changes in the inequality graph. The construction summary mentions the use of text1, a, b, text2, A, B, pic1 objects.
GeoGebra Commands & Parameters
a(x, y) = y < (1 / 2 * x)b(x, y) = y ≤ (-3 * x) + 7Point A(6.64, -4.2)Point B(16.585, -4.185)
AI Drawing Prompt Reference
Draw a coordinate system with two inequality function graphs, one where y is less than 1/2x and another where y is less than or equal to -3x plus 7, and mark two points located at (6.64, -4.2) and (16.585, -4.185), observing the effect of parameter changes on the inequality graphs.
The prompt above was compiled from the original drawing commands and is for reference only.