
Graphing in Polar Coordinates
Loading the math board and drawing, please wait…
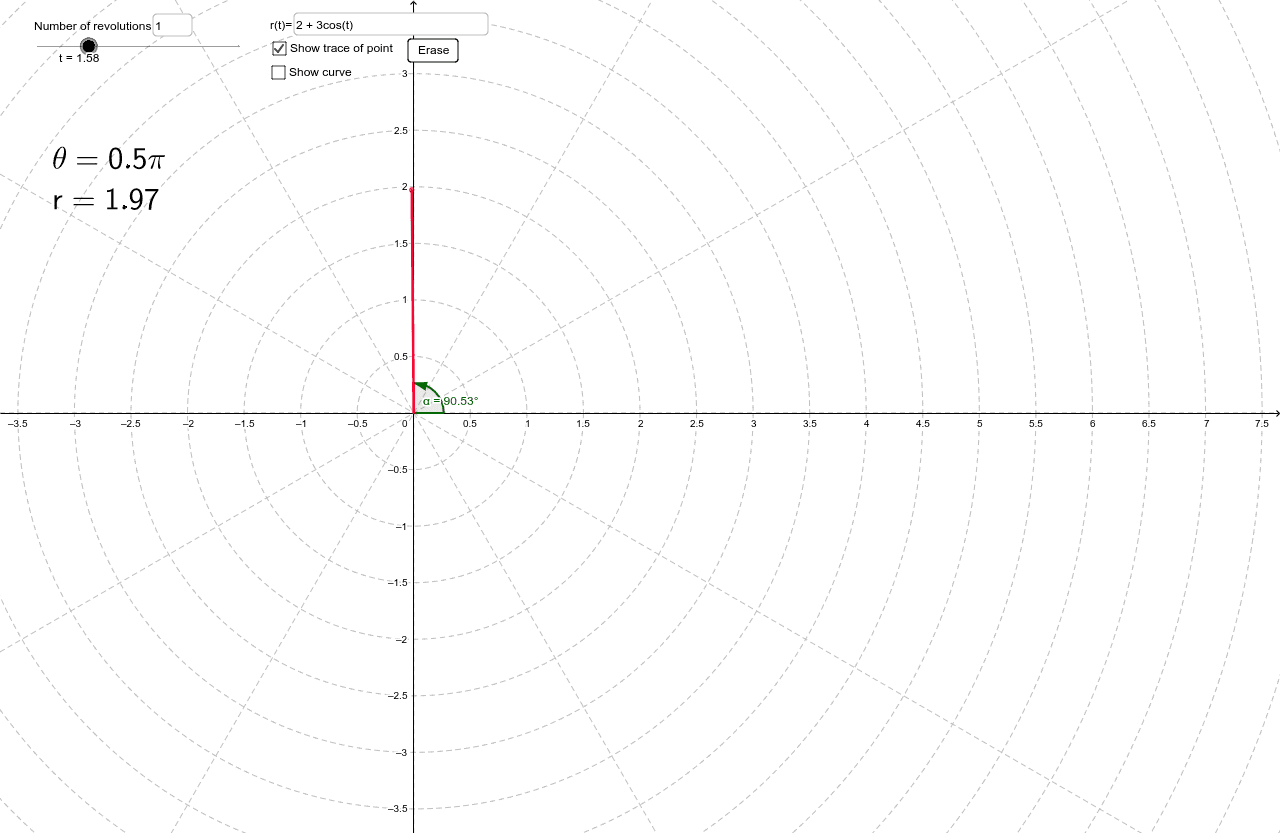
This example demonstrates how to graph functions in polar coordinates, showcasing dynamic transformations by adjusting parameters. Key math concepts include polar coordinate systems, trigonometric functions, geometric transformations, and parametric equations. It utilizes GeoGebra commands like Textfield, Segment, Locus, Angle, and objects such as r, t, A, inputBox1, a, button1, n, inputBox2, text2, b, loc1, c, r1, text1, α for dynamic control and trajectory tracking. Suitable for high school and above students to understand polar coordinate systems and parametric equations.
GeoGebra Commands & Parameters
Textfield(r) → inputBox1Textfield(n) → inputBox2Segment((0, 0), A) → bLocus(A, t) → loc1Angle((1, 0), (0, 0), A) → α