
Graphing Function Derivatives
Loading the math board and drawing, please wait…
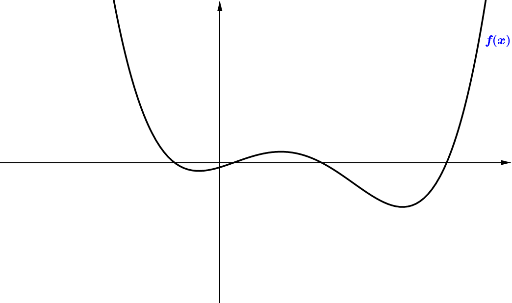
This example demonstrates how to graph a function and its derivative, visually illustrating the relationship between the derivative and the original function's graph. Core math concepts include the geometric meaning of derivatives, function graph properties, and rates of change. GeoGebra commands used: f (function), g (derivative function), h (auxiliary line/image), text1 (text annotation). Suitable for high school mathematics teaching to help students understand derivative concepts and applications.
GeoGebra Commands & Parameters
f(x) = x^(4) - (2.7 * x^(3)) + x^(2) + (0.7 * x) - 0.1g(x) = f'(x)h(x) = g'(x)
AI Drawing Prompt Reference
Draw a function and its derivative on the same graph, connect key points with a helper line, and label the expressions for both the function and its derivative to illustrate the relationship between the original function and its derivative, highlighting the geometric meaning and rate of change.
The prompt above was compiled from the original drawing commands and is for reference only.