
Investigating Limits Informally: A Visual Approach
Loading the math board and drawing, please wait…
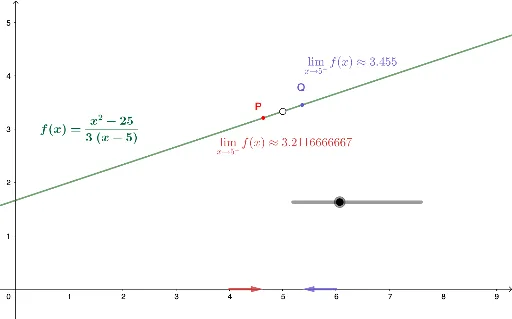
① This GeoGebra example demonstrates the informal concept of limits by showing how function values approach a target as the input approaches a point, using dynamic visual feedback. ② Core mathematical concepts include limits (two-sided and one-sided), continuity, and the behavior of sequences of points on the real number line. ③ Construction details: Based on the summary, it uses Point and Vector commands, creating objects such as function f, dynamic points A, P, Q, B, C, D, E, and text labels (text1, text2, text3) to display numerical values; users can drag points to observe how function values change and approach a limit. ④ Suitable for high school seniors or early university students learning calculus, as an introductory or review tool for limit concepts, and for teachers to demonstrate the intuitive meaning of limits through numerical and graphical exploration.
GeoGebra Commands & Parameters
Point(xAxis) → BPoint(xAxis) → CVector(B, D) → uVector(C, E) → v
AI Drawing Prompt Reference
Draw a coordinate plane with a function curve. Place two draggable points on the x-axis. From each point, draw a vector arrow to the corresponding point on the curve, showing the mapping from input to output. Display three text labels that show the current input value, the function value, and the difference between them. As the points are dragged along the x-axis, the numbers update dynamically, visually demonstrating how the function values approach a target value. Keep the background clean, emphasizing the curve, arrows, and dynamic numbers, suitable for illustrating the informal concept of limits.
The prompt above was compiled from the original drawing commands and is for reference only.