
Graphing Exponential Functions: Transformations
Loading the math board and drawing, please wait…
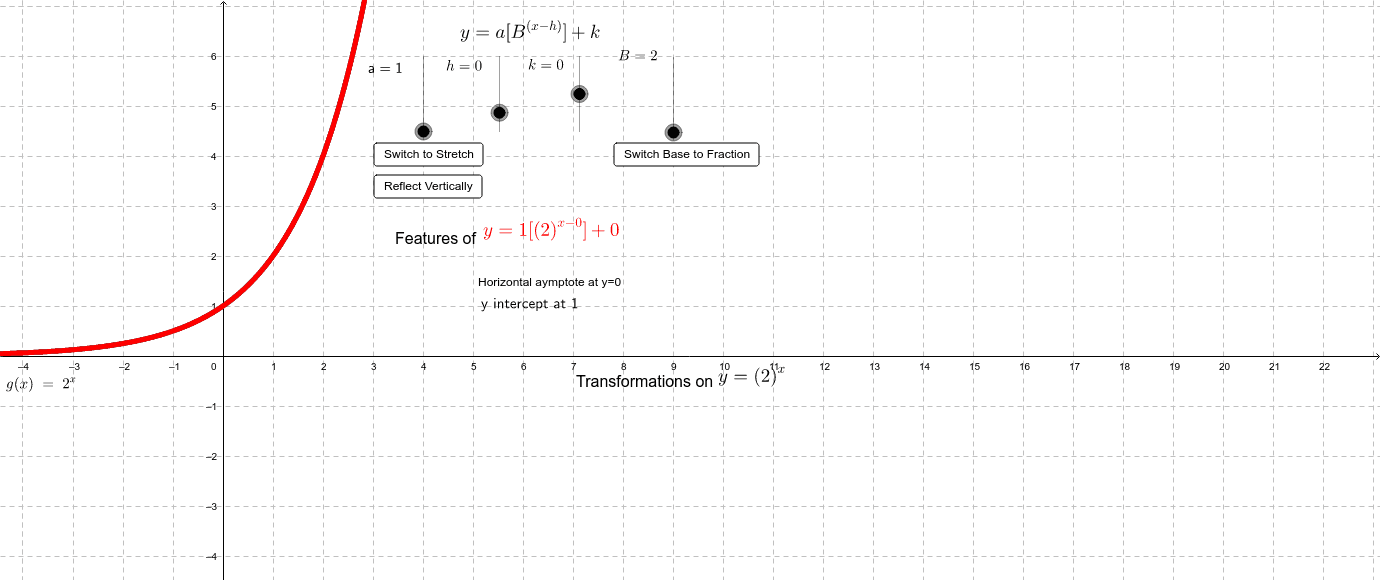
This example demonstrates how to graph exponential functions and explore the effects of transformations on their graphs. Key math concepts include exponential function properties and transformations (translations, stretches). It utilizes GeoGebra commands/objects like vr, cs, fractionbase, k, h, B, a, text elements, sliders, and buttons for interactive exploration. Suitable for high school mathematics education focusing on function transformations and graphing skills.
GeoGebra Commands & Parameters
Numeric vr(1.0)Numeric cs(-1.0)Numeric fractionbase(1.0)Numeric k(0.0)Numeric h(0.0)Numeric B(2.0)Numeric a(1.0)(a * a)(a * k)(a * h)g(x) = B^(x)Boolean stretch(true)f(x) = ((vr * a^(cs)) * (B^(fractionbase))^(x - h)) + k
AI Drawing Prompt Reference
Graph an exponential function to demonstrate transformations, starting with the base function g(x) = B^x. Use sliders to adjust parameters a, k, h, and B, where a modifies the base, k controls vertical shift, h handles horizontal shift, and B determines stretch. The initial graph is g(x) = 2^x, which transforms into f(x) with interactive adjustments, showing effects on the graph and labeling key points and transformation relationships.
The prompt above was compiled from the original drawing commands and is for reference only.