
Exploring Transformations of Sine and Cosine Functions
Loading the math board and drawing, please wait…
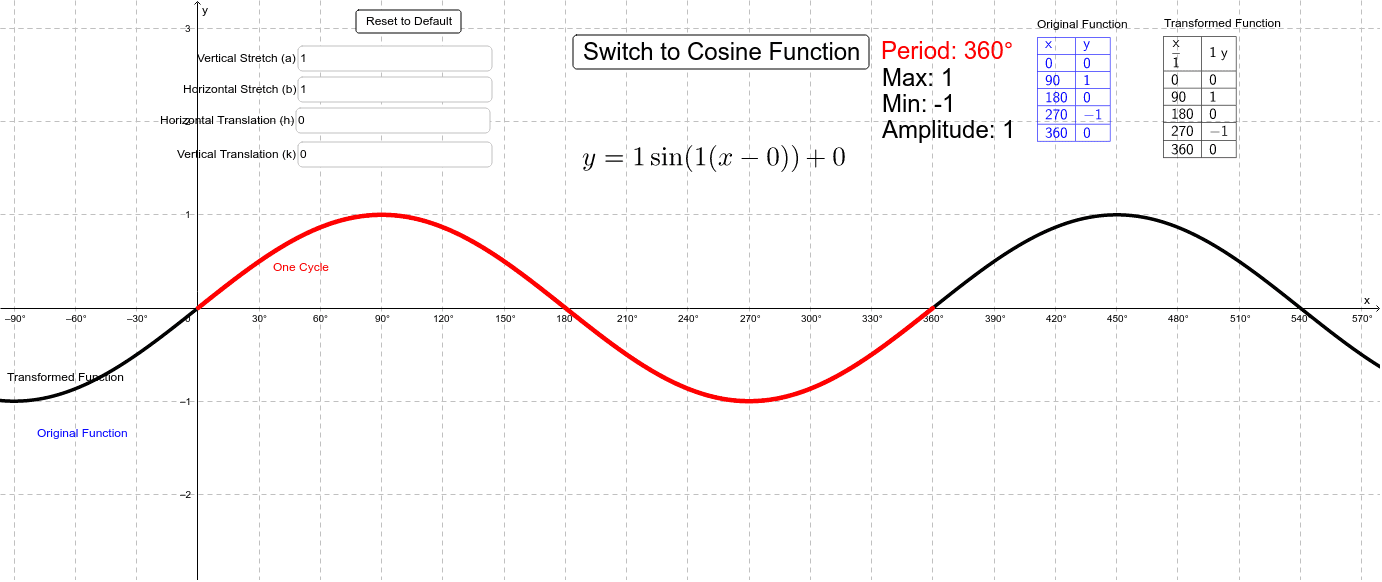
This interactive GeoGebra example demonstrates how geometric transformations affect the graphs of sine and cosine functions. It visually explores amplitude changes, period stretching/compression, horizontal phase shifts, and vertical translations. Core mathematical concepts include trigonometric function transformations, amplitude, period, phase shift, and vertical shift. The construction uses text fields and sliders to control parameters a, h, b, and k, defining transformed functions via the Function command)Skip. It also employs table text to compare function values, buttons to toggle between sine and cosine modes, and checkboxes to show/hide original and transformed graphs. Suitable for high school or introductory college students learning trigonometric graph transformations, as well as for classroom demonstrations or self-study.
GeoGebra Commands & Parameters
Textfield(a) → verticalStretchTextfield(b) → horizStretchTextfield(h) → horizTransTextfield(k) → verticalTransFunction((a * sin(((π / 180 * b) * (x - h)))) + k, 0, 360 / b) → SineOneCycleFunction((a * cos(((π / 180 * b) * (x - h)))) + k, 0, 360 / b) → CosineOneCycleTableText({{x, y}, {0, SineOrig(0)}, {90, SineOrig(90)}, {180, SineOrig(180)}, {270, SineOrig(270)}, {360, SineOrig(360)}}, "|_") → SineOrigTableTableText({{x / b - h, (a * y) + k}, {0 / b - h, (a * SineOrig(0)) + k}, {90 / b - h, (a * SineOrig(90)) + k}, {180 / b - h, (a * SineOrig(180)) + k}, {270 / b - h, (a * SineOrig(270)) + k}, {360 / b - h, (a * SineOrig(360)) + k}}, "|_") → text7TableText({{x / b - h, (a * y) + h}, {0 / b - h, (a * CosineOrig(0)) + k}, {90 / b - h, (a * CosineOrig(90)) + k}, {180 / b - h, (a * CosineOrig(180)) + k}, {270 / b - h, (a * CosineOrig(270)) + k}, {360 / b - h, (a * CosineOrig(360)) + k}}, "|_") → text9TableText({{x, y}, {0, CosineOrig(0)}, {90, CosineOrig(90)}, {180, CosineOrig(180)}, {270, CosineOrig(270)}, {360, CosineOrig(360)}}, "|_") → text10
AI Drawing Prompt Reference
Create an interactive demonstration of trigonometric function transformations, showing original and transformed sine and cosine graphs. Use four adjustable parameters to control vertical stretch, horizontal stretch, horizontal shift, and vertical shift. Include sliders or input fields for these parameters, and display the transformed function over one period. Provide tables comparing original and transformed values at key angles (0, 90, 180, 270, 360 degrees). Add buttons or checkboxes to toggle between sine and cosine modes, and to show or hide original and transformed curves. The layout should be clear for classroom use.
The prompt above was compiled from the original drawing commands and is for reference only.