
Graphing Exponential Functions by Carlos B. Vizcaino
Loading the math board and drawing, please wait…
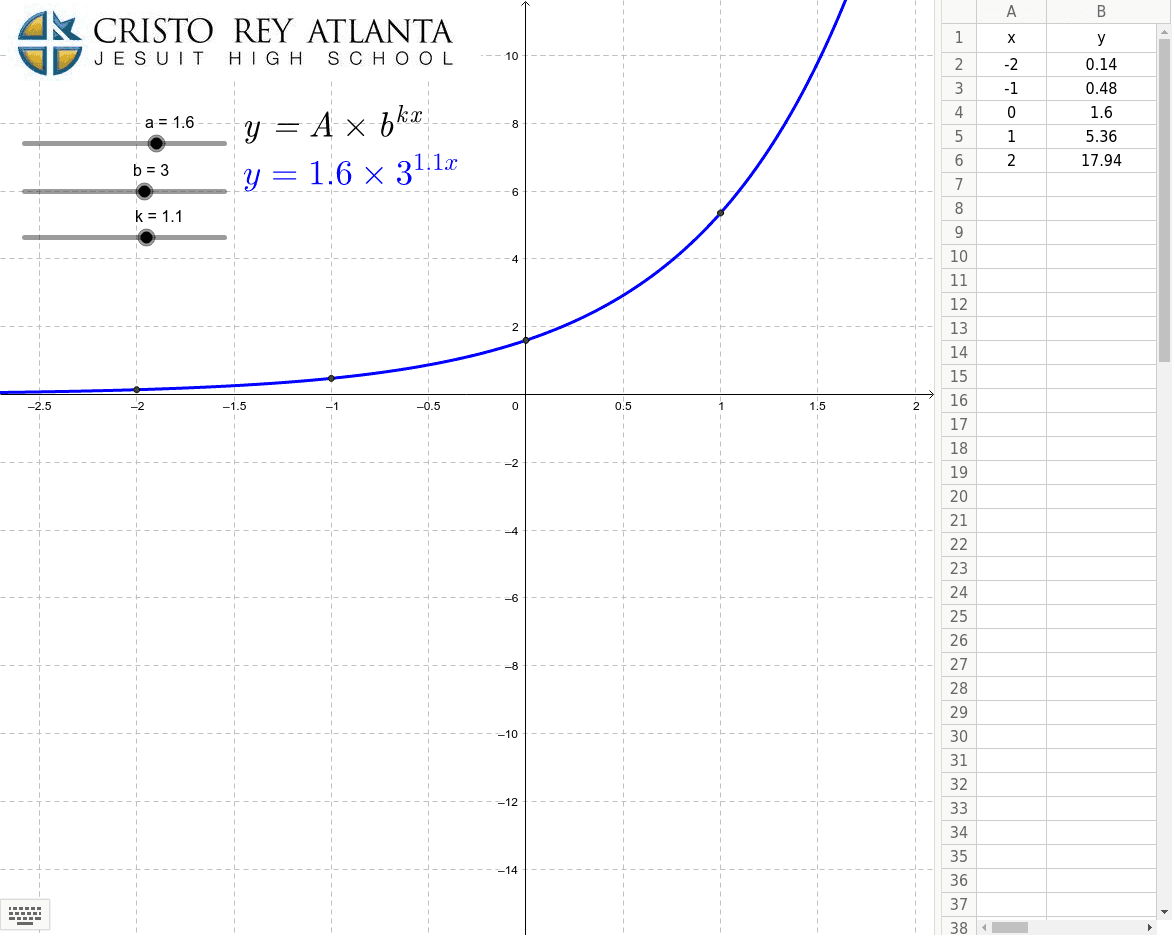
This example demonstrates how to graph exponential functions and observe the impact of parameter changes on the graph. Key math concepts include the properties of exponential functions, the effects of parameters a and b on the shape and position of the graph, and the role of k as the growth rate in the exponent. GeoGebra commands and objects used in the construction include: a, b, k, f, A, B, pic2, text2, text3, A1, B1, A2, B2, A3, B3, A4, B4, A5, B5, A6, B6, C, D, E, F, G, list1. It is suitable for high school mathematics teaching, helping students understand the characteristics of exponential function graphs and the role of parameter adjustment.
GeoGebra Commands & Parameters
Numeric a(1.6)Numeric b(3.0)Numeric k(1.1)f(x) = (a * b^((k * x)))Point A(-14.070243902439001, 9.66)Point B(-2.0721951219512116, 9.66)-2(a * b^((k * A2)))-1(a * b^((k * A3)))0(a * b^((k * A4)))1(a * b^((k * A5)))2(a * b^((k * A6)))(A2, B2)(A3, B3)(A4, B4)(A5, B5)(A6, B6){C, D, E, F, G}
AI Drawing Prompt Reference
Draw a graph of an exponential function defined by a base multiplied by the base raised to a power that includes a growth rate coefficient. The graph should show a smooth increasing exponential curve. Place several discrete points near the curve, with x-coordinates ranging from negative to positive, and y-coordinates computed from the function, to mark key positions on the curve. Additionally, add a horizontal reference line above the graph with two endpoints to help observe changes in function values. The overall layout should clearly display the growth trend of the exponential function and the effect of parameter adjustments on the curve shape.
The prompt above was compiled from the original drawing commands and is for reference only.