
Graphing Polynomial Functions by Carlos B. Vizcaino
Loading the math board and drawing, please wait…
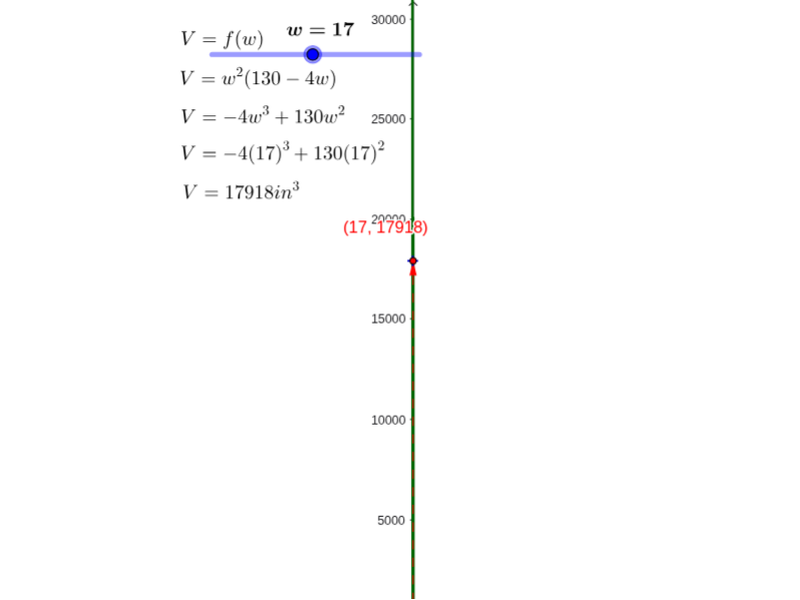
This example demonstrates the geometric construction of polynomial functions, involving concepts such as polynomial functions, division, and special points. Using GeoGebra commands like Intersect, Circle, and Polygon, the construction of polynomial function graphs is illustrated. Suitable for high school students learning polynomial functions.
GeoGebra Commands & Parameters
Intersect(xAxis, yAxis) → ACircle(A, a) → cIntersect(c, xAxis) → B, CPolygon(A, C, 4) → poly1, g, h, i, j, D, ECircle(C, l) → dPoint(d) → FSegment(C, F) → kCircle(F, a) → eOrthogonalLine(F, yAxis) → mIntersect(e, m) → G, HPolygon(H, F, 4) → poly2, n, p, q, r, I, JPolygon(C, F, I, D) → poly3, c_1, f_1, i_1, d_1Polygon(I, J, E, D) → poly4, i_2, j_1, e_1, d_2Segment(A, H) → sVector(P, R) → uVector(R, Q) → vMidpoint(c_1) → KMidpoint(g) → L